

Reactions, Returns & Volatility - Everything That Moves the Global Economy & Your Portfolio

On the day this article is published, Americans are voting in the midterm elections. Most of the attention will naturally be on politics, society and the economy. But for us, there is another way to look at it: through the eyes of an investor.
Any elections can bring a degree of uncertainty. They can reshape expectations around fiscal policy, regulation and the broader economic outlook. But beyond the political headlines, they also offer something particularly interesting from a quantitative perspective: recurring events that allow us to study how financial markets behave when their usual patterns are disrupted.
In this edition of Macro Moves, we put political considerations aside and approach elections as events in quantitative sense. Do markets become more volatile around elections? Does the initial reaction tell us anything about future returns? How long does it take for market conditions to normalize? And, perhaps most importantly, do elections coincide with market moves that cannot be explained by the factors that usually drive returns?

The first trading day after an election is where our story today really begins. Once the votes are counted, attention shifts from the election itself to what financial markets do next. This is when investors begin trading on the outcome, adjusting positions and reassessing expectations.
Measuring the market’s reaction is not quite as straightforward as simply looking at whether the S&P 500 rises or falls. A 1% move can be significant in a quiet market, yet barely visible when volatility is already high.
To account for this, we adjust the S&P 500’s return on the first trading day after an election for the volatility observed over the previous three months, or 63 trading days. This gives us a better sense of how strong the reaction really is compared with the market environment leading up to the vote.
Yes, this may seem like a deliberately simple approach. It cannot capture every source of market uncertainty or tell us how much of the result was already priced in before election day. But it does give us a consistent way to compare market reactions across different elections.

An initial market reaction is interesting in itself, but what matters for investors is what happens next. For midterms, stronger initial reactions have historically tended to be followed by weaker three-month returns. In more general sense, a bigger move immediately after the election has not necessarily meant better performance in the months that followed.
Presidential elections show a completely different pattern. Here, stronger initial market reactions have generally been associated with better returns over the following three months.
That contrast is interesting, but it should not be taken too far. The initial reaction seems to matter differently depending on the type of election. But history gives us a pattern, not a prediction of what comes next.
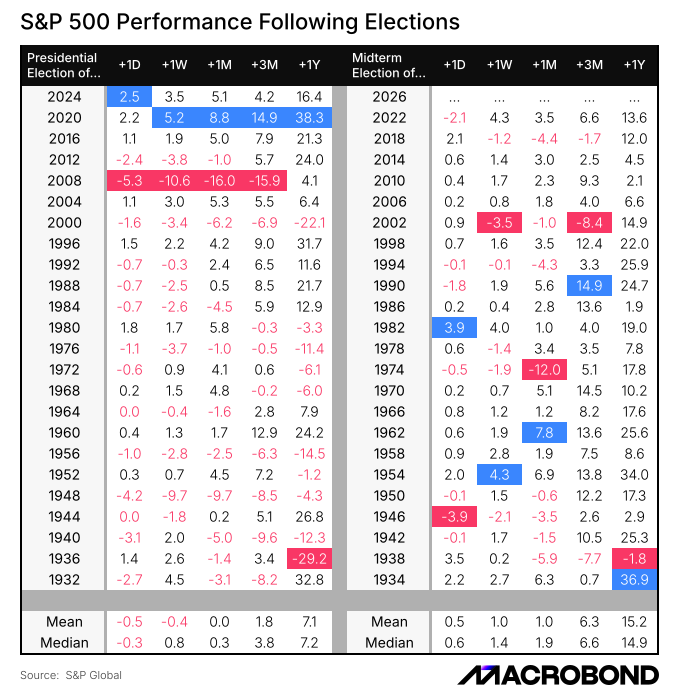
If the first three months tell one story, the following year tells another. Historically, the S&P 500 has returned around 15% in the 12 months following midterm elections, compared with roughly 7% after presidential elections.
That is almost twice as much.
Of course, 12 months is a long time in financial markets. These elections took place in very different environments, and plenty of other things happened along the way. Economic cycles change, monetary policy shifts and markets have many other factors to digest.
That brings us to another question: how much of this is really about elections? Are these returns simply part of the market's normal behavior, or is there something unusual happening around election periods?

So how can we tell whether these moves are actually unusual? The S&P 500 can rise or fall for many reasons that have little to do with an election. To account for some of these broader market forces, we use a simplified four-factor model and look at cumulative abnormal returns, or how the market performed relative to what the model would normally expect.
Abnormal returns tend to rise after presidential elections and move in the opposite direction after midterms. But in both cases, the effect gradually fades. The direction may differ, but the tendency towards normalization is surprisingly similar.
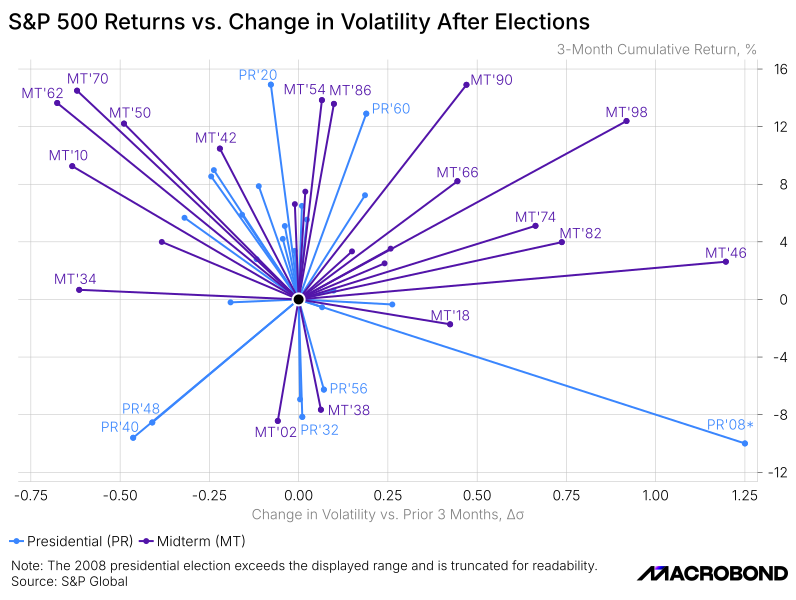
Returns tell us about market direction, while volatility tells us how much the market moves along the way.
To look at both together, we plot each election based on the change in realized volatility over the following three months and the S&P 500 return over the same period. The result shows considerable variation. Some elections were followed by higher volatility, others by lower volatility, while returns varied widely as well. In broader sense, there is no single combination of returns and volatility that tends to follow an election.
But when we step back and look across the entire sample, the picture becomes considerably calmer. Despite the wide range of individual outcomes, the mean changes remain relatively close to the center. Individual elections can therefore look quite different, even when the average response appears relatively modest.
There is, however, one catch with our volatility measure. We use the 63 trading days before an election as the reference period. That gives us a consistent benchmark, but it also means that what happened three months ago matters just as much as what happened last week.
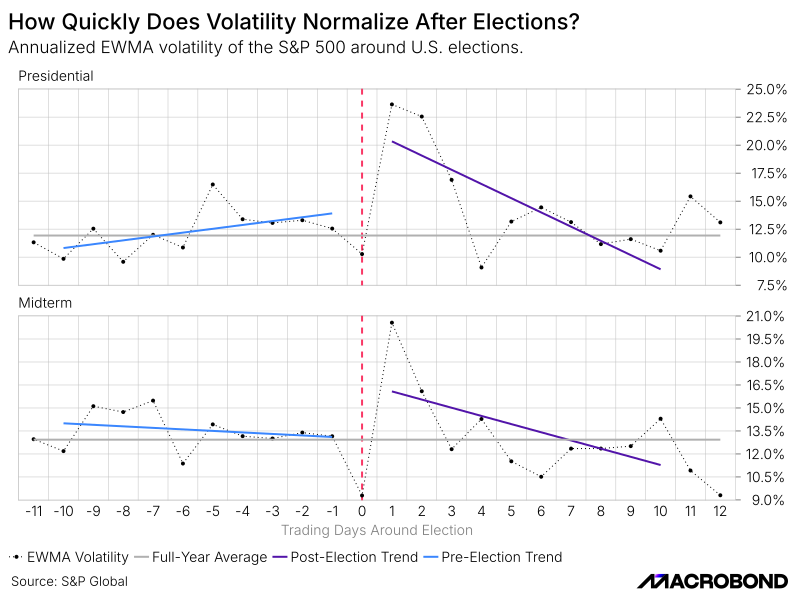
That can be a problem if volatility starts rising shortly before the vote. So we also look at an Exponentially Weighted Moving Average (EWMA), which gives more weight to recent observations and responds more quickly when market conditions change.
The result is quite telling. Volatility rises after both presidential and midterm elections, but not for long. Within roughly seven to eight trading days, it moves back towards its pre-election range.

So far, we have focused on the S&P 500 itself. But elections may affect more than the direction or volatility of individual assets. They may also coincide with changes in the relationships between them.
One important example is the relationship between stocks and government bonds, a key part of portfolio diversification. We measure this using beta, which tells us how the two assets tend to move relative to one another.
Across our sample, this relationship shifts following both presidential and midterm elections, with the beta generally declining during the post-election period. So the market reaction is not only about what happens to stocks or bonds individually. It can also be seen in how the two move together, with potential implications for portfolio diversification.
Presidential and midterm elections have historically produced different patterns in returns, volatility and the relationship between stocks and bonds. Some effects can be visible immediately after the vote, while others emerge over longer horizons. But importantly, many of these changes appear to fade with time rather than become permanent shifts in market behavior.
That makes elections interesting market events, but not necessarily reliable signals for what comes next. Their impact depends on the type of election, the market environment and, of course, everything else happening at the time.
And perhaps that is the main takeaway. Looking at elections quantitatively is less about predicting the next one and more about understanding the market reaction in context. History cannot tell us exactly what happens next, but it can tell us whether what we are seeing is really that unusual.


