

Patterns, Seasonality & Averages - Everything That Moves the Global Economy & Your Portfolio

Every investor has heard the old market saying: "Sell before September". The idea is repeated so often that it has become part of market itself. But unlike many seasonal trading rules, this one is backed by a surprisingly stubborn pattern. For decades, September has been the weakest month for equities - and no one has been able to fully explain why.
Is the September effect a real market pattern or simply the result of chance? And if it is more than a statistical quirk, what could explain it?
In this edition of Macro Moves, we examine nearly a century of stock market history, test the September effect across a wide range of statistical measures, and compare the results with evidence from equity markets around the world.
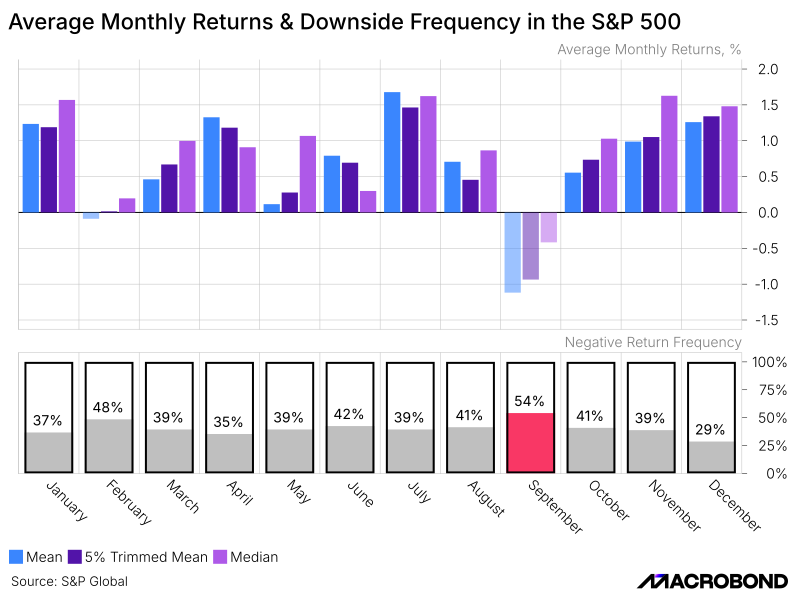
Let’s start with the most basic measure. Take the monthly returns of the S&P 500, split them into calendar months and calculate the long-term average return for each month separately: all Januaries together, all Februaries together, and so on. Then plot the results however you like – as columns, a line chart, or simply put them in a table – and the one thing hard to miss: September is an outlier. Its average return is negative. Not just slightly negative, but below -1% on average over the full historical sample.
But of course, a simple arithmetic average on its own does not prove very much. A few unusually bad Septembers could be enough to drag the figure down. That is why it makes sense to look at other measures as well.
Instead of the average, we can use the median return, which is less affected by extreme years. We can also use a trimmed mean that excludes the strongest and weakest observations. Yet the result hardly changes. September remains negative, whichever approach we use.
This is the September effect in its simplest form.
Why does the September effect exist at all? The short answer is that nobody really knows. Despite decades of research, there is no single explanation that most academics or investors would agree on. But one of the most common theories points to the mutual fund fiscal year, which historically ended on October 31 for many U.S. funds. Under this view, portfolio managers may sell losing positions in September to “tidy up” their portfolios before reporting them to clients.
The problem is that the September effect is not unique to the United States. Similar patterns can be found across many international markets, including those with fiscal calendars that have little in common with the U.S.
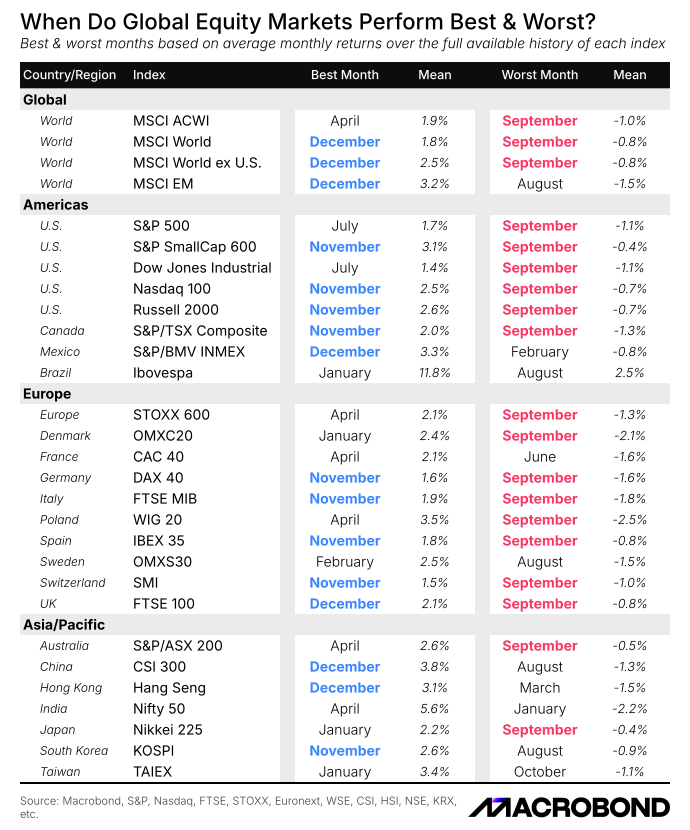
To see whether this is the exception or the rule, we ranked the months of the year by their average returns across roughly 30 equity markets worldwide. September seems to be the weakest month in most of them. The strongest month varied more from market to market, but November and December appeared near the top far more often than any other period.
This, of course, does not fully disprove the mutual funds theory, but it does raise an obvious question. If September effect can be found across markets with different institutions, different reporting requirements and different investor bases, perhaps the explanation lies elsewhere. Or perhaps there is no single cause at all.
Regardless of what the data show, the September effect still has its critics. Many argue that it is nothing more than a statistical quirk that has gained a reputation of its own. Another common counter argument is that September's negative average return is largely driven by a few of major market shocks and difficult periods in history, including the Great Depression, World War II, the Vietnam War and the oil crises of the 1970s.
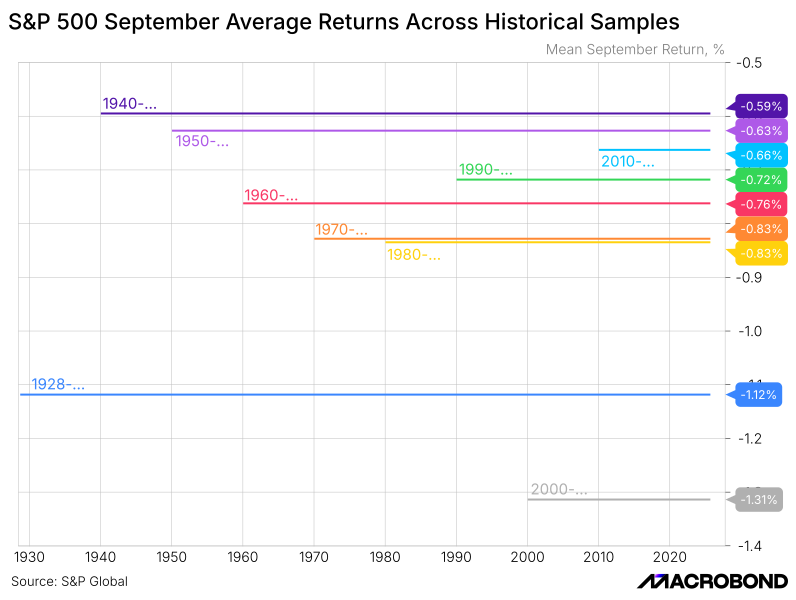
One way to test that claim is to reduce the impact of extreme observations using measures such as trimmed means (which we have already done). Another is to shorten the sample and focus only on more recent decades. The problem for the critics is that neither approach changes the picture very much. Whether the analysis begins in the 1950s, 1960s, 1970s or even later, September continues to produce negative average returns.
But perhaps the critics have a point. Even a trimmed mean alone is not enough to settle the debate. Market performance can be analyzed through lots of different measures, from simple returns and volatility to more advanced risk and distribution statistics.
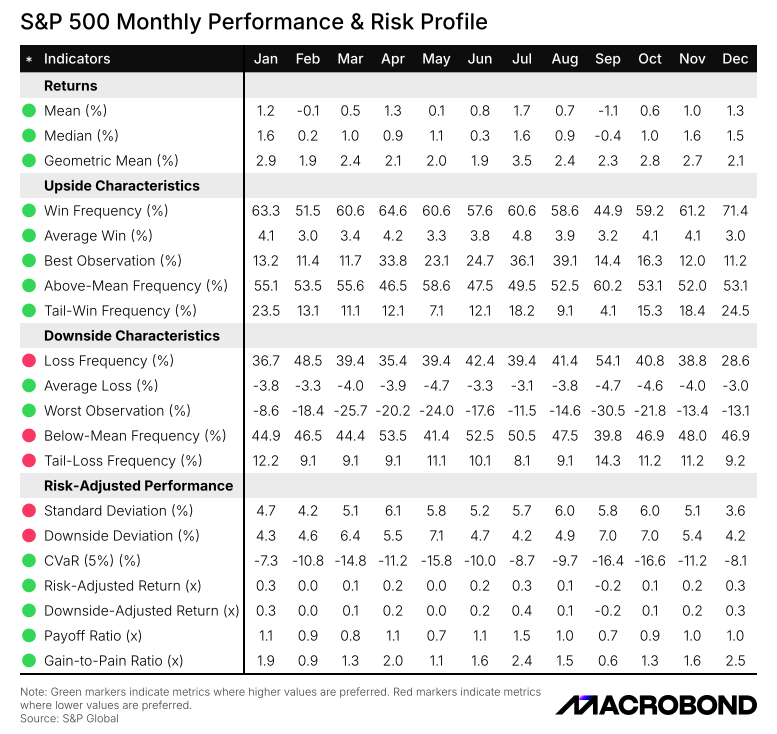
That’s exactly what we did - expanded the analysis well beyond simple averages. For each calendar month, we calculated more than 20 separate performance and risk measures.
Returns capture the average outcome. Upside metrics focus on the positive side of the distribution, measuring how often a month delivers above-average gains and how large those gains tend to be. Downside metrics provide the opposite perspective, capturing both the frequency and severity of losses, as well as behavior during particularly weak periods. Finally, we included a range of risk measures, from volatility to CVaR and risk-adjusted indicators similar to the Sharpe and Sortino ratios.
Together, these indicators provide a more complete view of each month's historical risk and return profile. If the September effect is nothing more than a statistical accident, this broader set of measures should make that clear
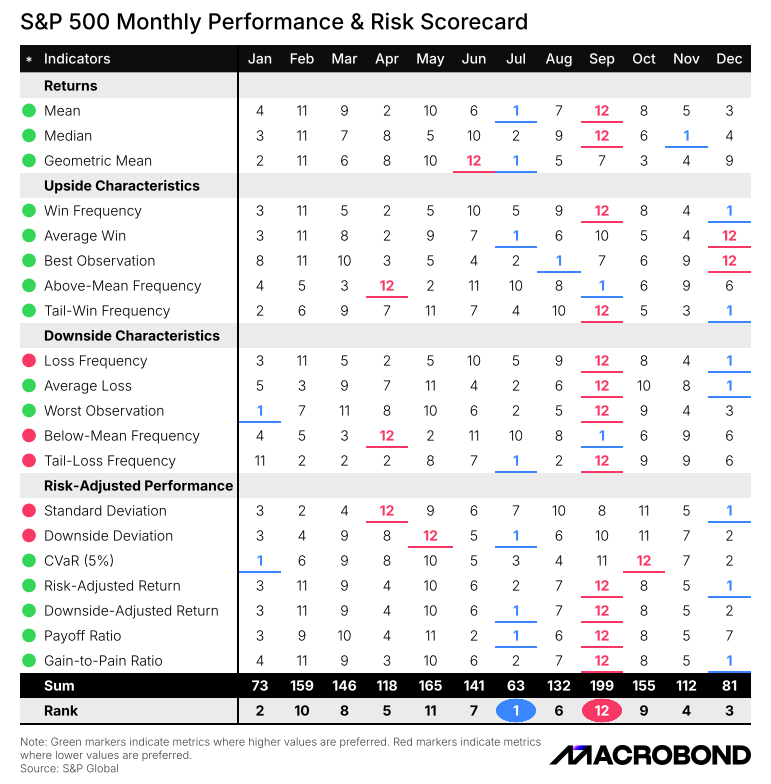
While each statistic tells us something useful, looking at more than 20 different metrics creates another problem: too much information.
To simplify the comparison, we built a simple ranking system. For each metric, every month receives a score from 1 to 12 based on its position in the ranking. The best-performing month gets 1 point, while the worst receives 12 points. For example, if July has the highest average return, it receives 1 point. If September has the lowest, it receives 12.
The process is then repeated across all metrics and the scores are summed for each month. The lower the total, the stronger the month's overall profile, while higher scores indicate weaker performance.
By this methodology, little changes. September remains the weakest month of the year. It ranks near the bottom across most indicators and finishes last overall. The few exceptions are measures tracking how often returns end up above or below September's own long-term average. But this is hardly a victory. If a month already has the lowest average return of the entire calendar year, clearing that bar is not much of an achievement.
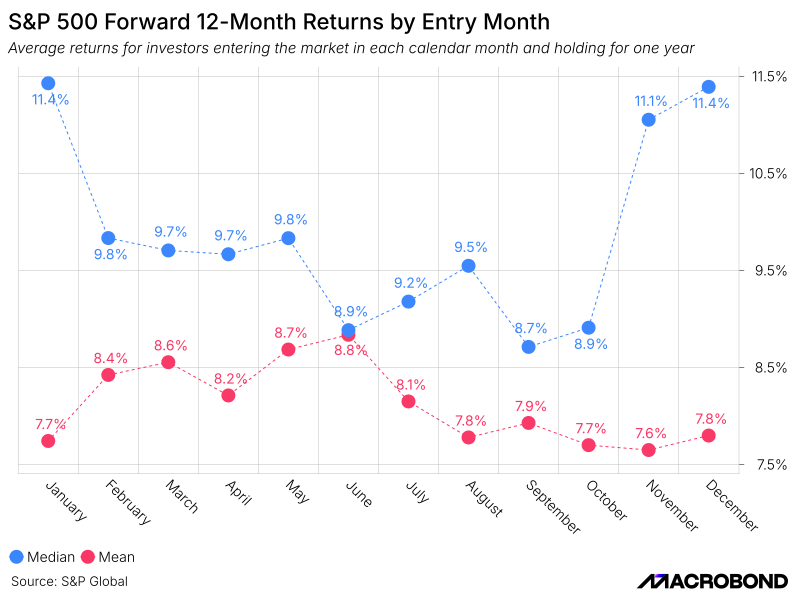
So if September is consistently the weakest month of the year, does that create an opportunity? Put differently, is there a case for "buying the September dip"?
The data offers no clear answer. If an investor buys the S&P 500 during September and holds the position for the following twelve months, the results are not particularly weak. September does not rank among the best entry months, but neither does it rank among the worst (finally). That distinction belongs to November, which has historically produced the weakest average return over the next year.
Based on average returns alone, September sits somewhere in the middle. The picture becomes less favorable, however, when median returns are used instead. Once the impact of a few of exceptionally strong years is reduced, September slips back toward the bottom of the ranking.
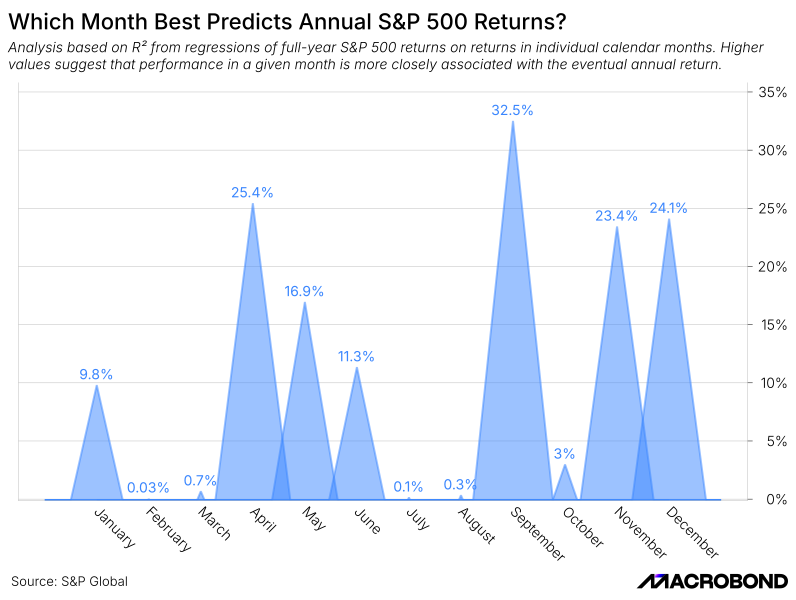
Is there at least one area where September stands out positively? Apparently so - forecasting power.
That may sound odd given its reputation as the market's weakest month, but September shows the strongest relationship with the S&P 500's full-year outcome. Looking at a simple regression between monthly returns and the index's annual return, September produces the highest R², exceeding 32%.
That figure is far from conclusive and should not be treated as statistically significant. Still, it suggests that September contains more information about the year's eventual outcome than any other month.
Why this relationship exists remains unclear. We haven’t found any convincing explanation in the academic literature, so the result may well be a statistical coincidence. But whatever the reason, it is one of the more surprising findings in our analysis. While September consistently ranks as the S&P 500's weakest month by all possible statistical measures, it also appears to be the month that says the most about how the year will end.


