Visualize

Turn complex analysis into decision ready visuals

Turn complex analysis into clear visual insights that support decisions. Macrobond’s time-native support and seasonally adjusted forecasting handle the heavy lifting, so you can focus on high value decisions. Produce clear, consistent outputs faster using templates, adapt existing visuals, or create your own from scratch. Every change updates instantly, making it simple to explore, refine, and share your findings.

Shape your story in seconds

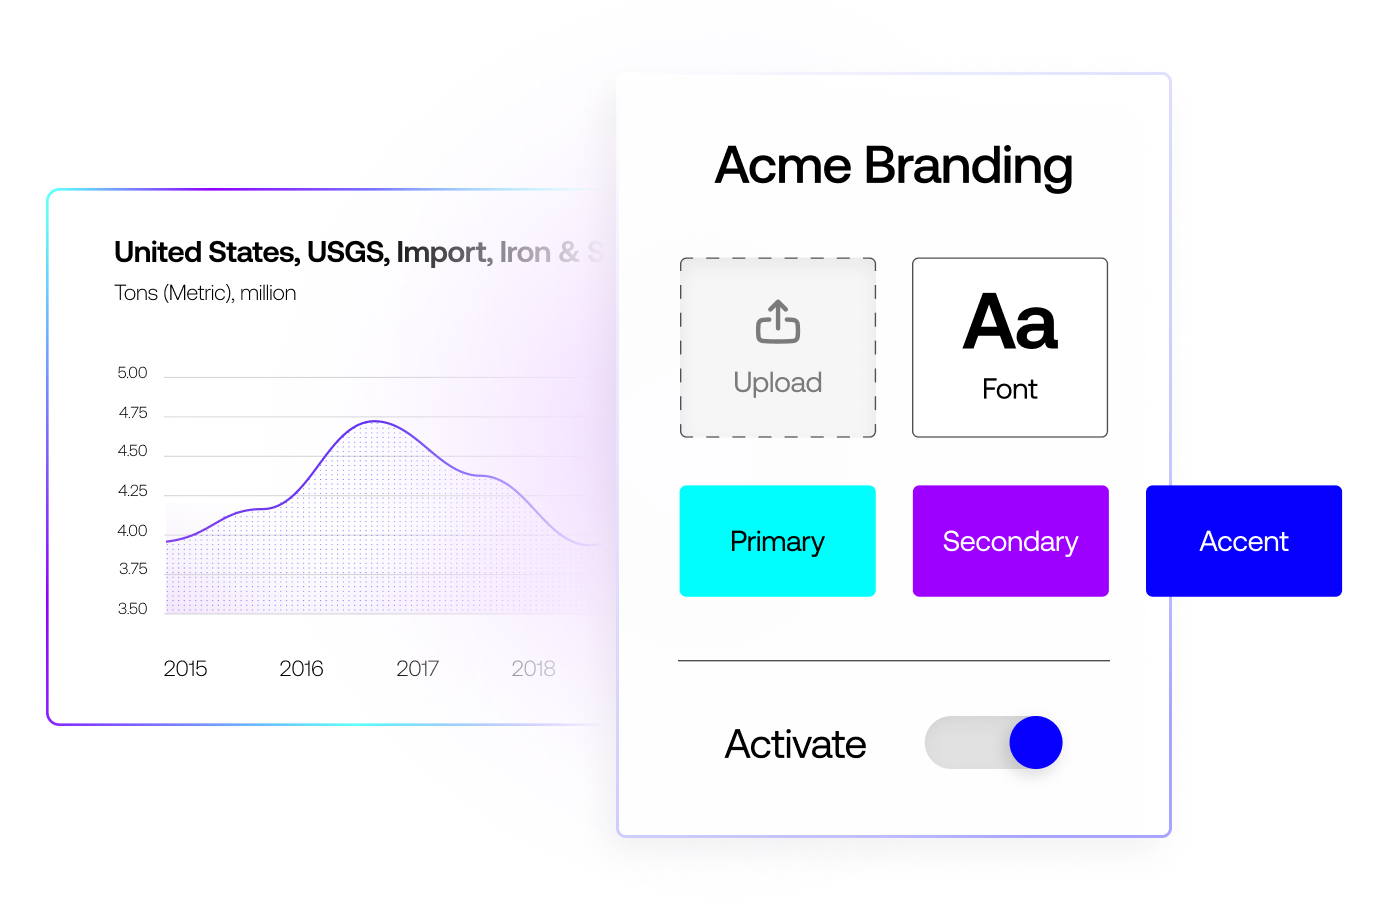
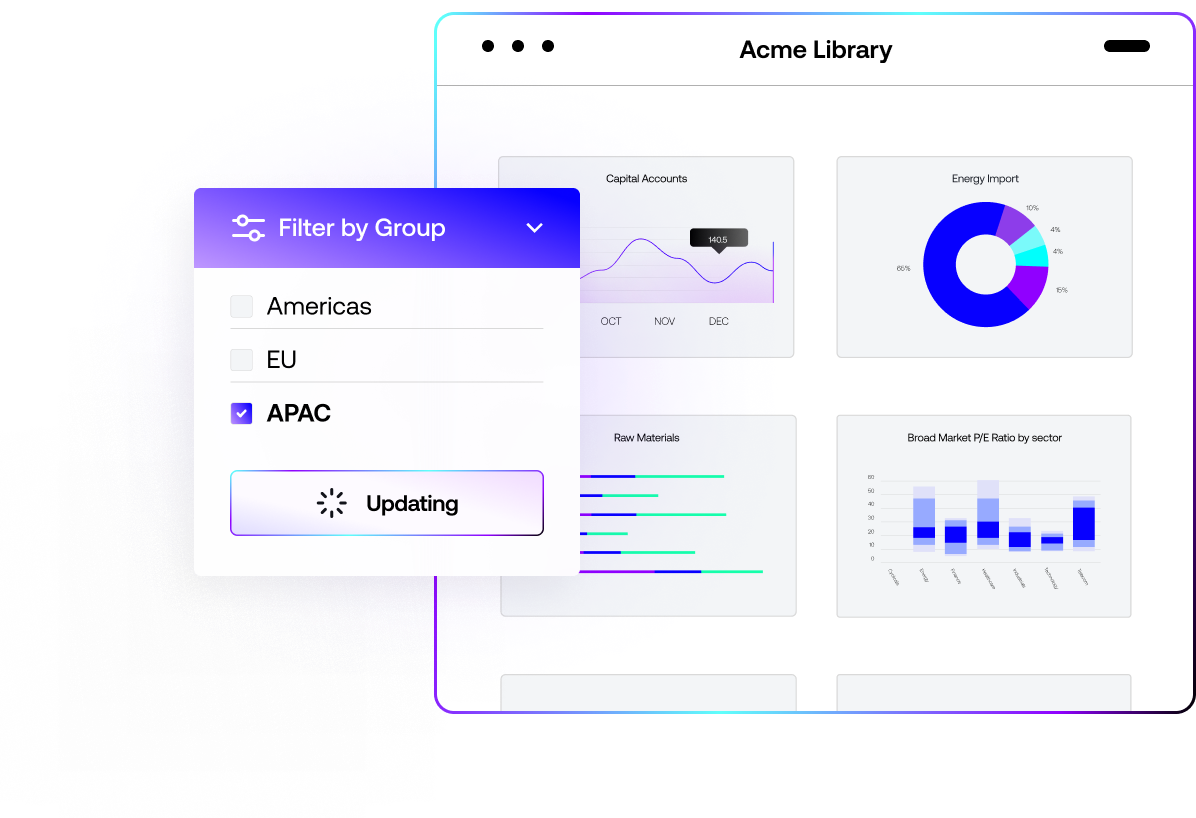
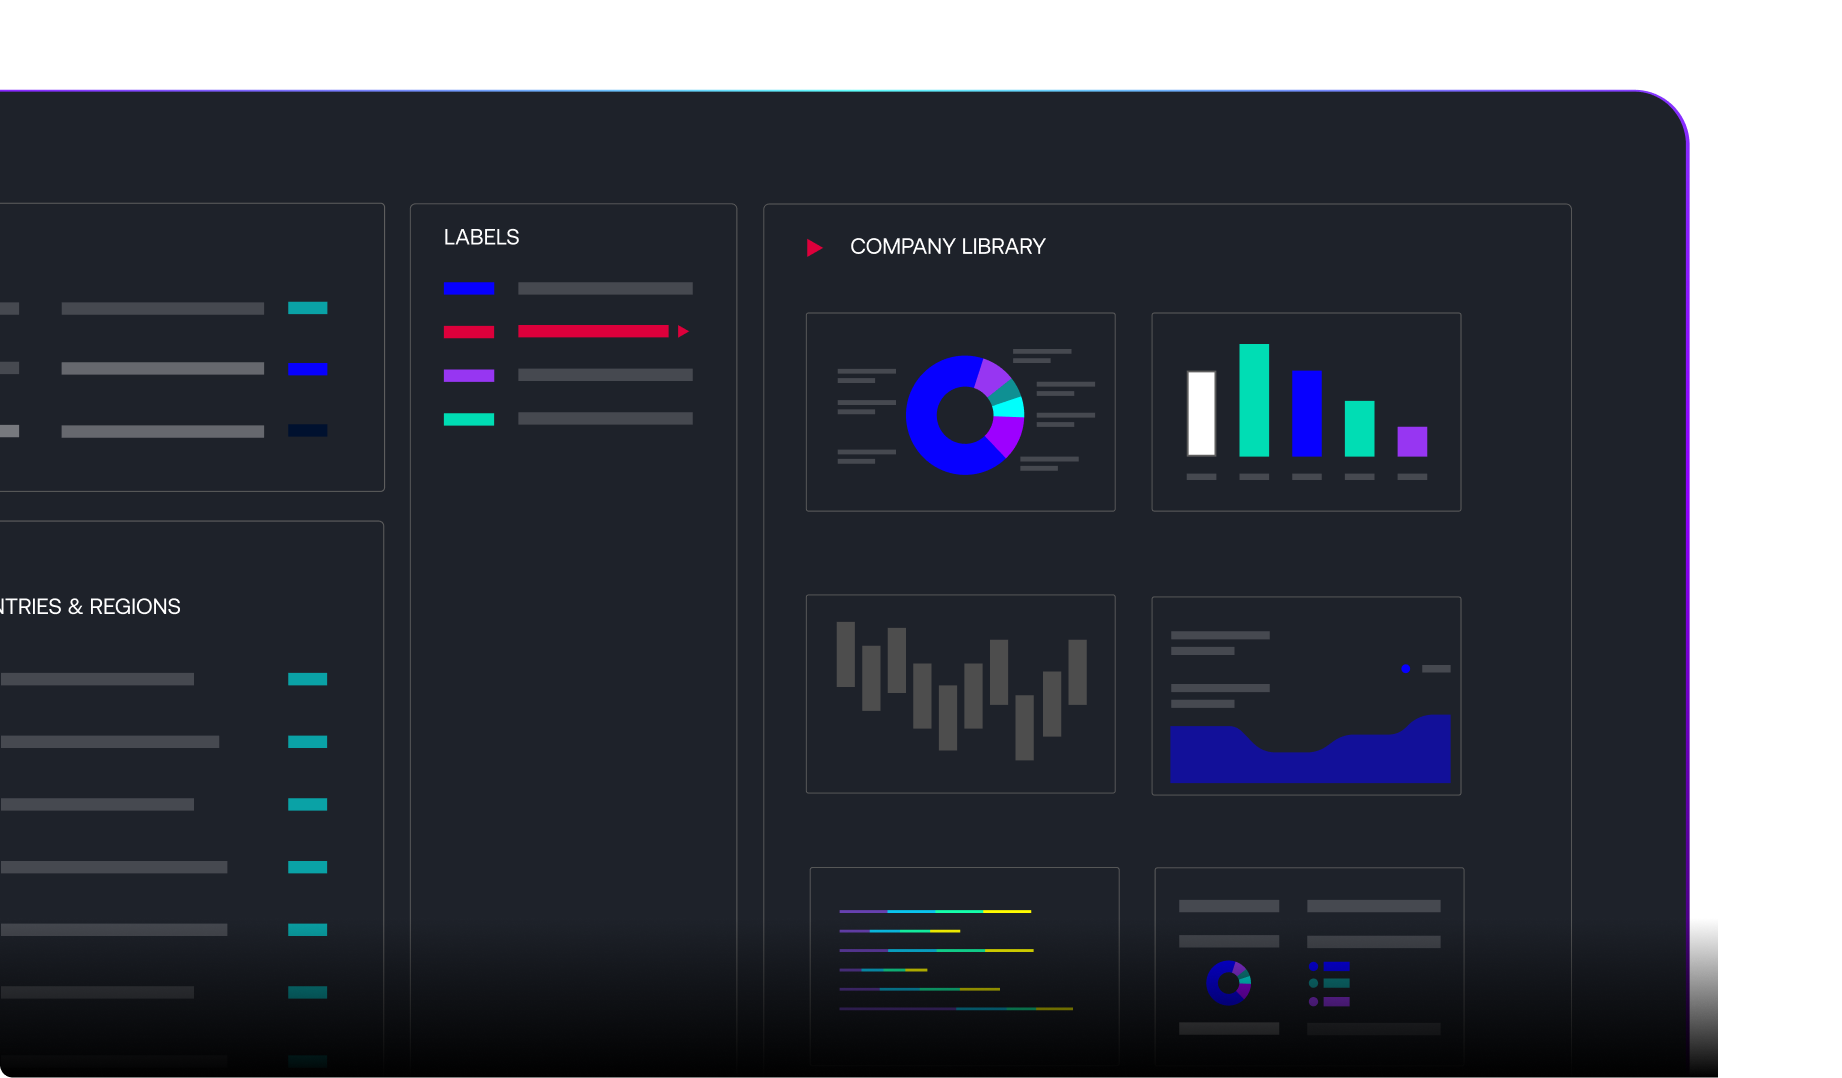
Get your analysis ready without losing momentum. Apply brand fonts, colors, and logos automatically so every visual looks consistent and professional. Charts stay linked to real-time data, so you can pull an old chart off the shelf and have it immediately up to date and relevant.

Chart icon
Easily fine-tune series, adjust scales, and test different assumptions, keeping every visualization accurate and relevant without rebuilding from scratch.
Upload your corporate branding once and apply it every time for consistent reports and presentations.
Data icon
Organize your work in shared folders, leave in-chart comments, and route it to the right people to review, edit, and approve.

Macro Series: Latest Insights

Macro Trends

Get a peek at tomorrow, today. Watch economic patterns take shape every other Friday with Macro Trends.
El Niño: From Ocean Temperatures to Economic Risk
View the Trends
Beyond De-Dollarization - The FX Creditability Test
View the Trends

Macro Charts

Fresh from the markets. Our latest batch 
of financial insights. Check out the latest releases in this week’s Macro Charts.
Week of June 22, 2026
Get the Charts
Week of June 15, 2026
Get the Charts

Macro Moves

Go deeper with lesser-known and newly added datasets every month with our Macro Moves.
Is AI Behind the Changes in the Labor Market?
See the Moves
Global Fertilizer Crisis, or How Energy Shocks Ripple Through Agriculture
See the Moves