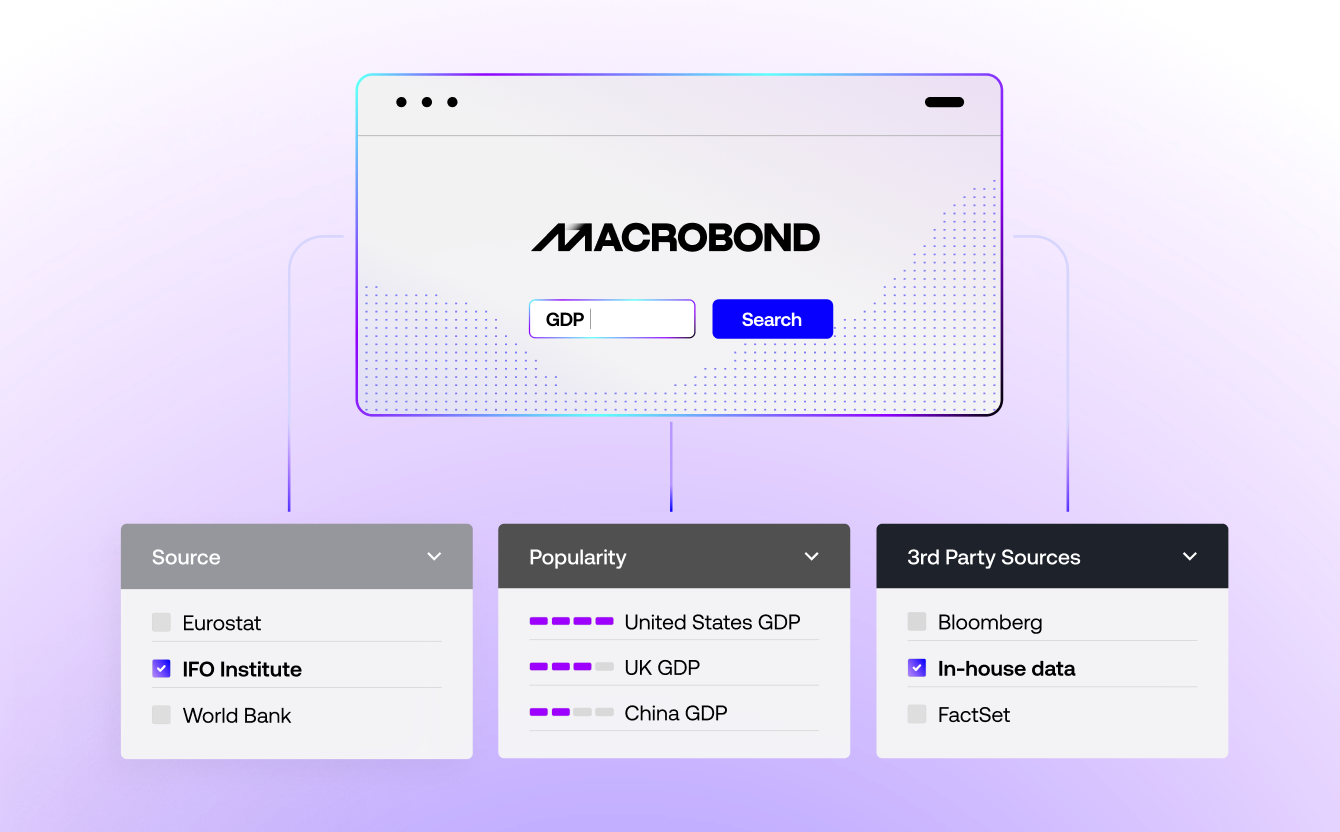
Transform your research workflow with Macrobond Analysis

Hundreds of macroeconomic and financial research teams trust Macrobond Analysis to access the data they need, conduct their analysis, and visualize and share insights and recommendations with their teams and clients.

Request a demo

Thousands of data sources,
one convenient tool

Macrobond Analysis users have the data they need at their fingertips, avoiding tiresome data cleanup and moving from idea to execution faster.

Jumpstart analysis with +300m time series from 2,400 sources, maintained and audited for consistency by the Macrobond team.  
Intuitive discovery tools, rich metadata, and full revision history help teams quickly find the right data to support and test their theories.
Add third-party data from partners like Bloomberg, FactSet, Oxford Economics, and more. Or connect your own in-house data.

Calculations covered,
all the way from aggregates to zero coupon rates

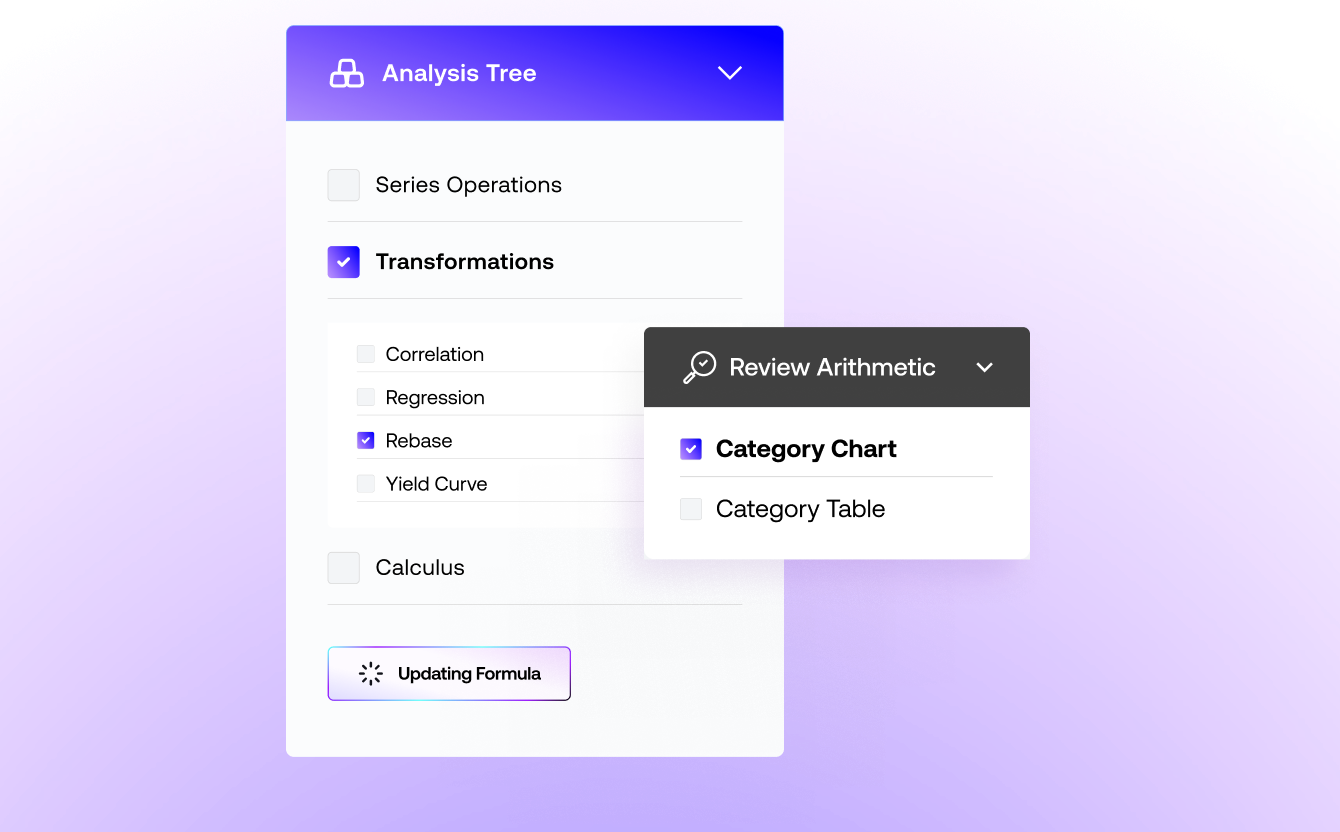
Leave spreadsheets behind and uplevel your work with Macrobond Analysis’ built in analytical functions, advanced formula builders, and statistical and modeling software integrations.

Easily apply dozens of calculations with a single click. From every day tasks like smoothing and rebasing, to more advanced tasks like yield curves, seasonal adjustments and vector auto regressions, Macrobond makes exploring and analyzing data easy.
Intuitive discovery tools, rich metadata, and full revision history help teams quickly find the right data to support and test their theories.
Use Macrbond Analysis’ formula language to tackle custom analysis or for more advanced statistical projects, easily integrate third-party statistical or modeling software to enrich your Macrobond charts. 


Less clutter, more clarity

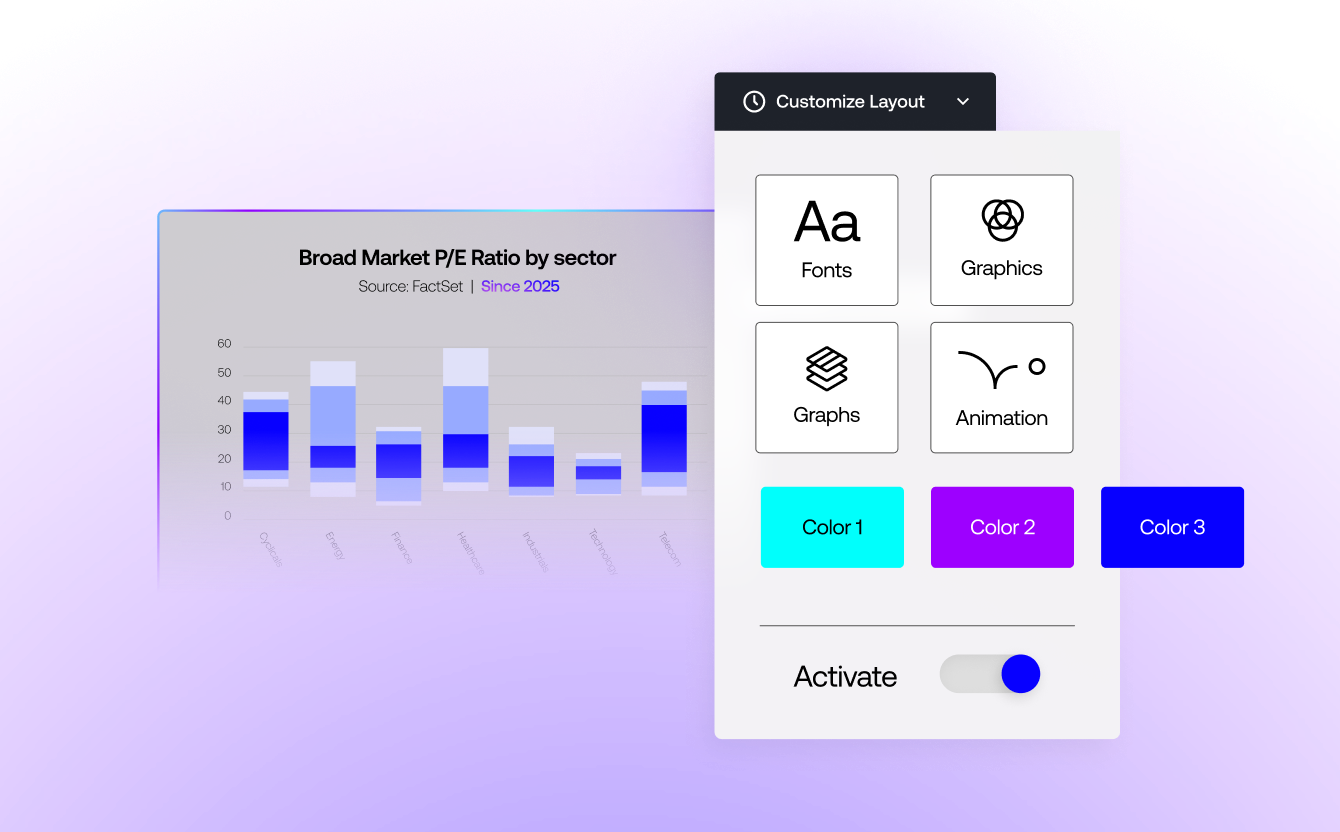
Communicate your findings and add context to your analysis with Macrobond Analysis’ pre-built charts and graphs or jumpstart your process with thousands of pre-built charts in the Macrobond Chart Library.

Turn time series and analysis into dozens of charts and graph types with the click of a button.
Adjust axes, add commentary, and adjust brand and colors with built-in tools.
Drive home key insights with exportable animations. 


Analysis in the hands of your stakeholders

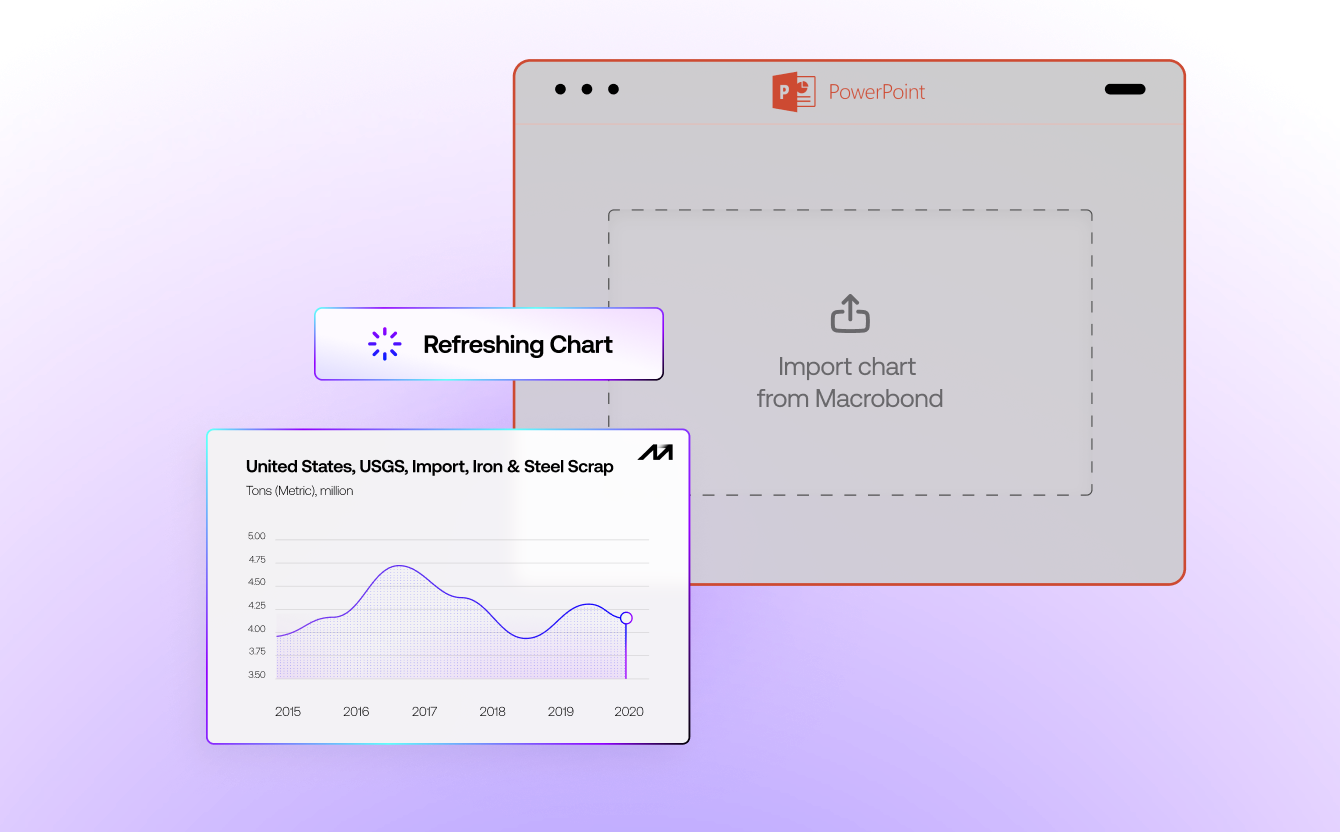
Whether updating a deck as new data drops or sharing a house view on social media, Macrobond Analysis equips you with the tools to showcase your analyses in its best light.

In-depth Microsoft PowerPoint and Excel integrations with the ability to refresh charts with new data directly from the deck.
Easily publish to social media channels directly from Macrobond Analysis. 

Export charts and graphs as high-quality images. 


Chosen by leading financial minds

Great tool
The tool is very practical and helps me to do my analyses quickly and automatically update them.
Thiago Campos
Economist
Turim
Go-to resource for macro data
Macrobond is great if you want macro data. It's that simple. I do not get why you would use anything else for day-to-day macro analysis. The app is easy to use, too.
Ben Ford
Strategist
Macro Hive
Great software for macro economic analysis
The interface and that the software has a lot of data. Also integration to Bloomberg and Excel.
Andreas Hild
Trader
Sjunde AP-fonden, AP7
An exceptionally user-friendly economic database
The user interface of Macrobond is so easy and intuitive to use. With a few clicks, you can find the data you need, modify it, and create charts and tables. On the very infrequent occasions that something doesn’t work, or there are some errors in the data, a message to the support team gets it quickly corrected.
Roger Wessman
Economist
Bastiat Consulting Oy
Time-saving, excellent, and professional service
Data volume, refreshing data in real-time, graph illustrations, some econometric methods, customer support, ease of integration.
Thomas Obst
Senior Economist
Institut der deutschen Wirtschaft
Great for macro analysis and report generation
One-click refresh makes updating regular reports easy. Also love the embedding functionality in Excel and PowerPoint, saved me a lot of time.
Veronica Yu
Research Associate
QuadReal Property Group
Macroeconomic analysis in a short time with excellent charts
We appreciate the quick search for economic indicators, the vast number of databases the software offers, and the Charts of the Week to go beyond in-house analysis. Easy to manage and create charts from scratch.
S. Arturo Martínez
Economics | Public Policy | Academic Research
American Chamber of Commerce of Mexico
User-friendly with comprehensive data for charting
The user-friendly interface is highly appreciated, making it incredibly intuitive to navigate. Additionally, the tool offers excellent capabilities for creating charts quickly and efficiently, which is a standout feature for users who prioritize speed and productivity. Great customer support.
Filipe Aires Lopes
Equity Strategist
Analistas Financieros Internacionales
Automates research and saves a lot of time
As a daily user of Macrobond, I find its core feature, “the auto-updated graphs,” to be incredibly valuable. The ability to create a relevant diagram and then watch it update automatically every day, month, quarter, or year is simply fantastic and saves a tremendous amount of time.
Brill Ivarson
Analyst
Svensk Handel
My poor life as a researcher / analyst / strategist / economist is only in the history books
[Now I have the] ability to spend more of my time communicating my research, rather than running the numbers on my research… to spend more time with my children, as I no longer need to work late nights collecting data and running regressions, getting rid of insignificant variables or the lags of the variables. I didn’t need to see Excel ever again.
Francis Tan
Chief Strategist, Asia
CA Indosuez Wealth Management
One of the best tools I have used
Ease of use, depth of data, ability to discover new data, the efficiency it creates in my life. Every person I have interacted with from there has been helpful and kind. I have worked in my field for 20 years and this is perhaps the best tool I’ve used in that whole time.
Mark Franceski
Multifamily Industry Analyst, Data Analytics and Business Intelligence
Zelman & Associates - A Walker & Dunlop Company
Time saver
Anyone who had the misfortune of having to update Excel charts understands how much of a time saver Macrobond is. Data updates automatically flow through and the ease of sharing is a huge improvement for cross-team compatibility. The customer support is also fantastic.
John Bromhead
Associate Portfolio Manager
Australian Super
Biggest productivity gain in macro research of my career
The integration with Powerpoint and Excel has made refreshing client pitch decks a matter of minutes rather than hours. The help desk is great too – adding new data sources when we make requests within a few days, making less need for webscraping on our side.
Jordan Rochester
Head of FICC Strategy
Mizuho
Great for creating and automating charts
Quick and easy to create simple visualisations, good detailed database. Integration with Powerpoint, Excel, and Bloomberg are very useful – I tend to use it every day. Easy to reformat and share charts in different ways.
James Wilson, CFA
VP - EM Sovereign Debt Strategist
ING
Macrobond is a very powerful market data tool
What I like most is the concept of creating a chart and having it update itself each time. It is a very useful time saver and relatively easy to learn.
Alejandro Carrera
Investment Strategy
ING Bank
Macrobond helps us scale our business
Macrobond underpins the work we do within our outsourced CIO business. Helping us to make investment decisions as well as clearly articulate to our clients what we are doing and why.
Jacqueline Fernley, CFA, CEW Member, GAICD
Chief Investment Officer
Microba Life Sciences
A great product!
Macrobond is very easy to use and update for investment research analysts
Sylvia Liang, CFA
Macro Investor at UBS Asset Management
UBS Asset Management
Offerings

A plan for every need

From solo analysts to global teams, Macrobond scales to simplify research and free time for real analysis and better decisions.
Empower your teams to deliver data, analysis, and insight across your business with purpose-built tools to help them work and collaborate at scale.
Research teams needing shared access, collaboration, and scalable delivery of macro and financial insights.
Build, iterate, and publish complex models and analysis with a tool that combines macroeconomic, financial, in-house, and third-party time series together in a single environment.
Individuals needing a single environment to model, analyze, and visualize macro and financial data.
Create straightforward analysis and visualizations with structured, true-to-source macroeconomic and financial data.
Individuals needing structured data and out-of-the box tools.