Stay current with the latest insights on global markets, macro, and more. Click the button below to subscribe to the series: Charts, Trends and Moves.

Catch up on Straight from the Force with Hervé Amourda, Chief Economist at PRO BTP Finance. Watch as we explore the shift from structural disinflation to a more volatile and uncertain inflation environment. We examine what's driving this change, how central banks are adapting their approach, and what it means for policy, rates and risk assets in today's evolving macro landscape.
On June 3rd 2026, we were joined by Hélène Baudchon, Deputy Chief Economist & Head of Global Macroeconomic Research at BNP Paribas, for an in-depth discussion examining Europe's resilience in a world defined by successive shocks - from US trade tensions to conflict in the Middle East and shifting EU–China dynamics. We explored the key events shaping Europe's outlook, the region's evolving strategic autonomy, and how policymakers and markets responded as Europe's economic revival and global position were put to the test. This session was held in French.

AI can accelerate research, but only connected workflows turn insights into decisions. Learn why the future of research depends on organizational alignment, not just AI.

Financial institutions are discovering that AI success depends on workflow infrastructure, not just better models or faster analysis.

Macrobond hosted a panel at Alpha Edge North America on AI enhanced portfolio construction, quant investing, and the future of institutional research workflows.

AI experimentation is everywhere in financial services, but production deployment remains limited. The challenge is not data quality or model capability. It is the missing reasoning layer that enables AI to interpret macroeconomic data with context, structure, and domain understanding.

Macrobond CEO Stephanie Covert shares why AI alone won’t transform financial research and how a strong data foundation is essential to deliver trusted, defensible insights at scale.

FactSet data, now in Macrobond.
On June 3rd 2026, we were joined by Hélène Baudchon, Deputy Chief Economist & Head of Global Macroeconomic Research at BNP Paribas, for an in-depth discussion examining Europe's resilience in a world defined by successive shocks - from US trade tensions to conflict in the Middle East and shifting EU–China dynamics. We explored the key events shaping Europe's outlook, the region's evolving strategic autonomy, and how policymakers and markets responded as Europe's economic revival and global position were put to the test. This session was held in French.
Catch up on Straight from the Force with Hervé Amourda, Chief Economist at PRO BTP Finance. Watch as we explore the shift from structural disinflation to a more volatile and uncertain inflation environment. We examine what's driving this change, how central banks are adapting their approach, and what it means for policy, rates and risk assets in today's evolving macro landscape.

Join NewEdge Wealth Management and Macrobond for Macro Outlook: Q2 for Macro and Markets on April 8th, 2026. Explore a live discussion covering the impact of the Iran War on developed market consumers and implications for asset allocation and central banks.
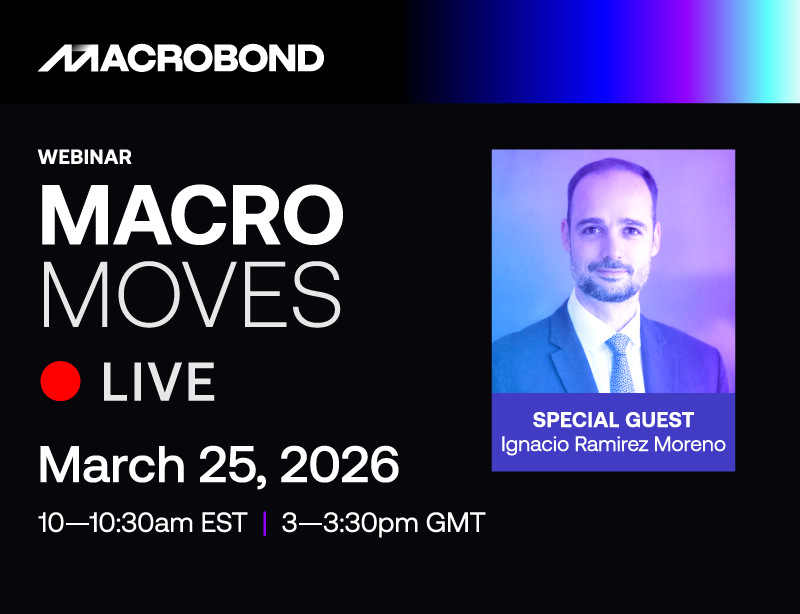
March: Macro Moves Live - with featured guest Ignacio Ramirez Moreno. Join us for our monthly webinar series that brings our latest releases to life. Each session breaks down the most important macroeconomic signals shaping markets today and shows how leading economists, strategists, and portfolio teams turn those signals into clear, actionable narratives using Macrobond.

Macro Moves Live is a monthly webinar series that brings our latest releases to life. Each session breaks down the most important macroeconomic signals shaping markets today and shows how leading economists, strategists, and portfolio teams turn those signals into clear, actionable narratives using Macrobond.
Join Macrobond, Numerator, and Kraft Heinz for MacroOutlook: The State of the U.S. Consumer on December 11, 2025. Explore how inflation, interest rates, tariffs, and labor trends are shaping U.S. consumer behavior and the 2026 economic outlook.

Join us in conversation with Saurabh Katiyar, CFA, Executive Director and Head of Equity Investing Research, EMEA at MSCI, on November 6, 2025, for a data-driven discussion on diversification, regional dynamics, and long-term opportunities in European markets.
On September 24th, 2025, Indicio joined Macrobond to discuss how real-time forecasting and mixed-frequency data give investors and economists the edge to anticipate volatility, manage USD risks, and sharpen strategies.

On September 3rd 2025, Quant insight joined Macrobond for a high-impact session decoding what’s really driving markets right now across FX, rates, and equities; with powerful analytics you won’t get anywhere else!

Discover how Antiloop AB, a Stockholm-based hedge fund, transformed its research workflow with Macrobond. By replacing manual Excel processes with instant access to global macroeconomic data, Founder Anna Svahn unlocked faster analysis, custom index building, and creative freedom in commodity investing.
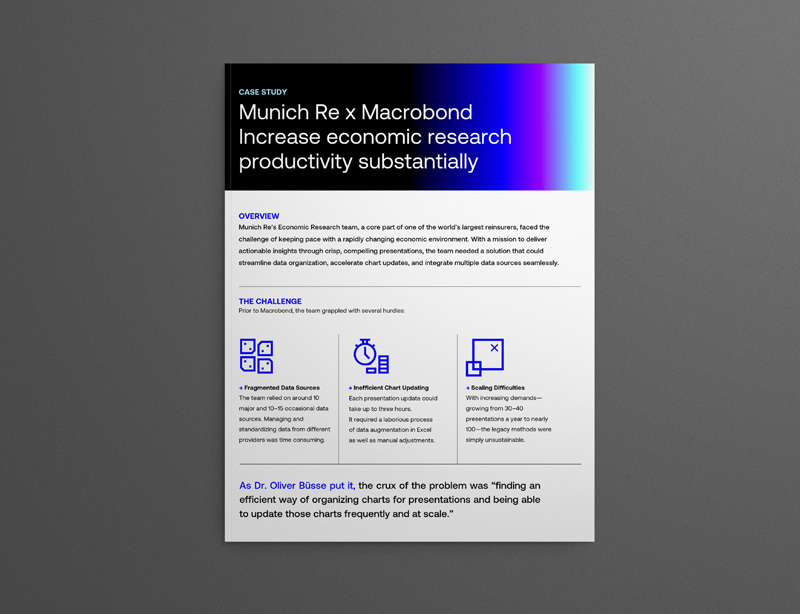
Munich Re’s research team streamlined research workflows and turned complex data into insights quickly by integrating sources and automating chart updates with Macrobond.

A faster path from question to insight.

Reimagining research for speed, scale, and collaboration.

Fresh from the markets - our latest batch of financial insights released weekly.

Fresh from the markets - our latest batch of financial insights released weekly.

Fresh from the markets - our latest batch of financial insights released weekly.

Fresh from the markets - our latest batch of financial insights released weekly.

Fresh from the markets - our latest batch of financial insights released weekly.

Fresh from the markets - our latest batch of financial insights released weekly.

Fresh from the markets - our latest batch of financial insights released weekly.

Fresh from the markets - our latest batch of financial insights released weekly.

Fresh from the markets - our latest batch of financial insights released weekly.

Fresh from the markets - our latest batch of financial insights released weekly.

Fresh from the markets - our latest batch of financial insights released weekly.

Fresh from the markets - our latest batch of financial insights released weekly.

Fresh from the markets - our latest batch of financial insights released weekly.

Fresh from the markets - our latest batch of financial insights released weekly.

Fresh from the markets - our latest batch of financial insights released weekly.

Fresh from the markets - our latest batch of financial insights released weekly.

Fresh from the markets - our latest batch of financial insights released weekly.

Fresh from the markets - our latest batch of financial insights released weekly.

Fresh from the markets - our latest batch of financial insights released weekly.

Fresh from the markets - our latest batch of financial insights released weekly.

Fresh from the markets - our latest batch of financial insights released weekly.

Fresh from the markets - our latest batch of financial insights released weekly.

Fresh from the markets - our latest batch of financial insights released weekly.

Fresh from the markets - our latest batch of financial insights released weekly.

Fresh from the markets - our latest batch of financial insights released weekly.

Fresh from the markets - our latest batch of financial insights released weekly.

Fresh from the markets - our latest batch of financial insights released weekly.

Fresh from the markets - our latest batch of financial insights released weekly.

Fresh from the markets - our latest batch of financial insights released weekly.

Fresh from the markets - our latest batch of financial insights released weekly.

Fresh from the markets - our latest batch of financial insights released weekly.

Fresh from the markets - our latest batch of financial insights released weekly.

Fresh from the markets - our latest batch of financial insights released weekly.

Fresh from the markets - our latest batch of financial insights released weekly.

Fresh from the markets - our latest batch of financial insights released weekly.

Fresh from the markets - our latest batch of financial insights released weekly.

Fresh from the markets - our latest batch of financial insights released weekly.

Fresh from the markets - our latest batch of financial insights released weekly.

Fresh from the markets - our latest batch of financial insights released weekly.

Fresh from the markets - our latest batch of financial insights released weekly.

Fresh from the markets - our latest batch of financial insights released weekly.

Fresh from the markets - our latest batch of financial insights released weekly.

Fresh from the markets - our latest batch of financial insights released weekly.

Fresh from the markets - our latest batch of financial insights released weekly.

Fresh from the markets - our latest batch of financial insights released weekly.

Fresh from the markets - our latest batch of financial insights released weekly.

Fresh from the markets - our latest batch of financial insights released weekly.

Fresh from the markets - our latest batch of financial insights released weekly.

Fresh from the markets - our latest batch of financial insights released weekly.

Fresh from the markets - our latest batch of financial insights released weekly.
Fresh from the markets - our latest batch of financial insights released weekly.
Fresh from the markets - our latest batch of financial insights released weekly.
Fresh from the markets - our latest batch of financial insights released weekly.
Fresh from the markets - our latest batch of financial insights released weekly.

This edition of Macro Trends explores how China’s export economy is shifting up the value chain, driven by years of industrial policy and investment in advanced manufacturing. The analysis examines the rise of semiconductors, electric vehicles, and high-tech exports, alongside the growing role of ASEAN in reshaping regional supply chains and trade flows.

This edition of Macro Trends examines how a new El Niño cycle could reshape the global macro landscape through its effects on agriculture, commodity markets, trade flows, inflation, and fiscal stability. The chart pack explores the climate signals pointing to renewed Pacific warming, the economies most exposed to weather-related disruption, and the transmission channels through which El Niño affects growth and prices. From agricultural dependence and food inflation risk to commodity market performance and export vulnerability, the edition highlights why climate variability remains an increasingly important macroeconomic force for investors and policymakers alike.

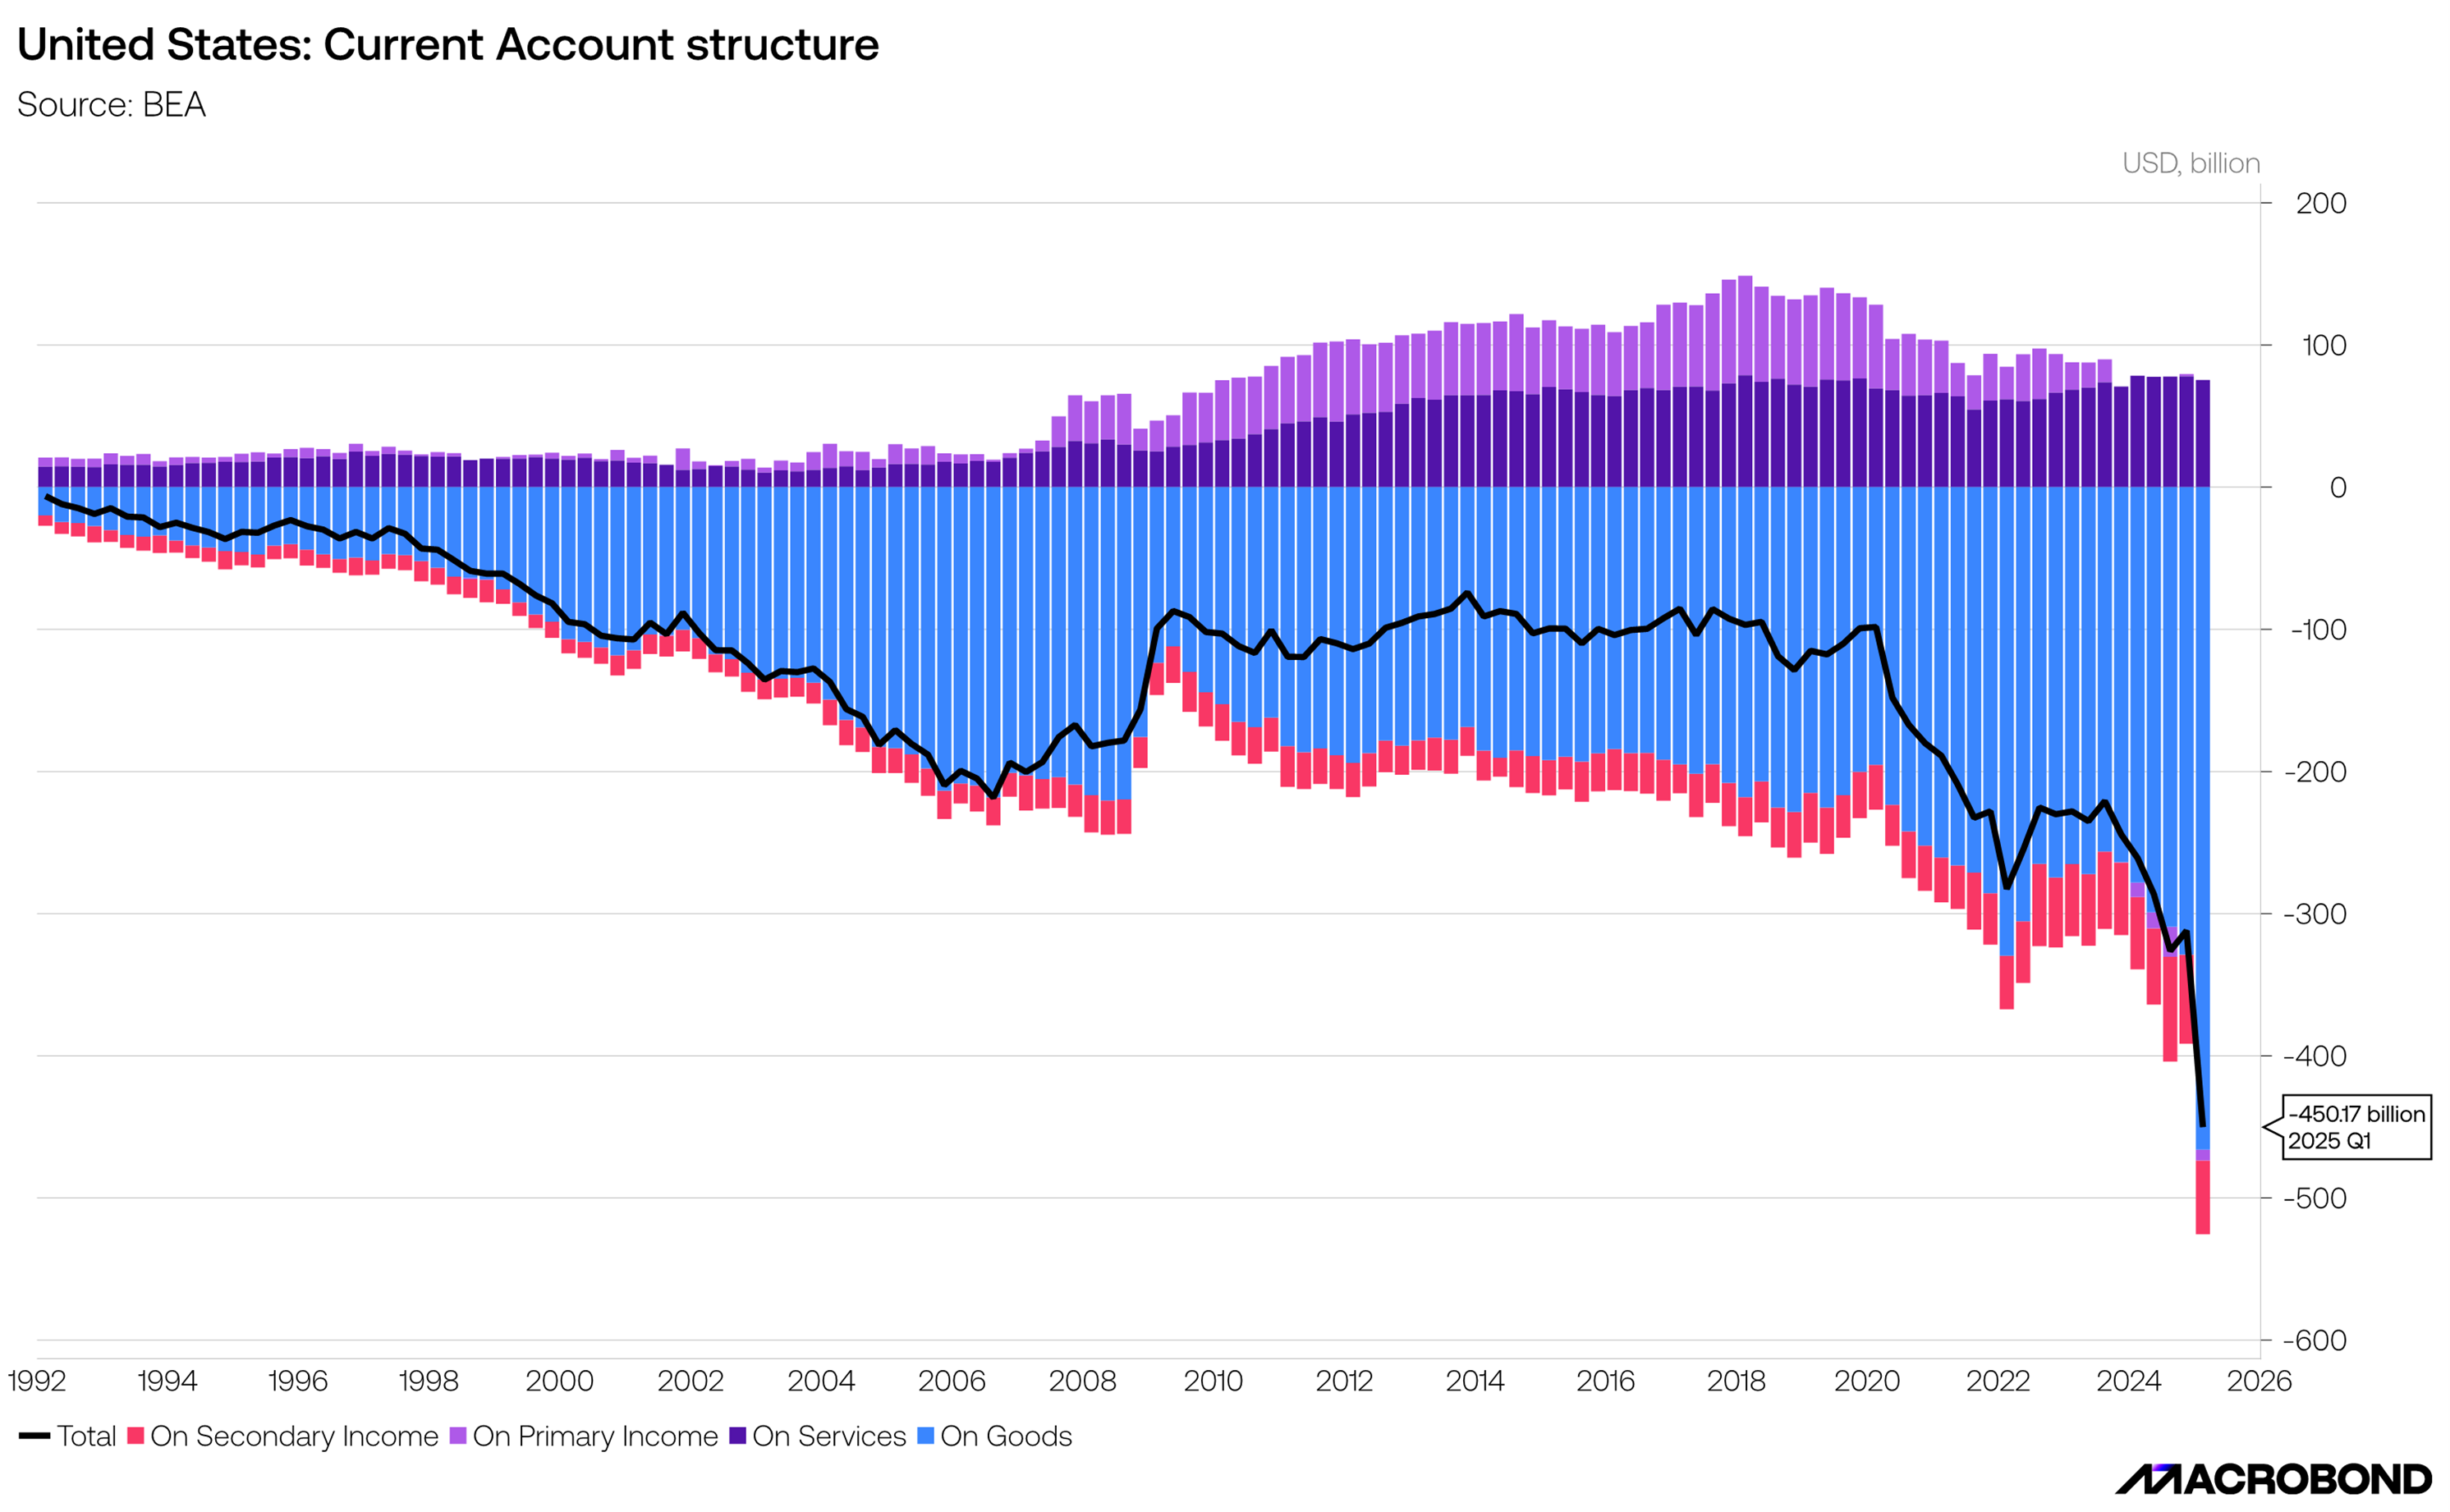
This edition of Macro Trends explores how the global dollar system is being tested - from shifting reserve allocation and FX positioning to policy credibility, carry dynamics and real-rate divergence across major economies. This edition examines whether de-dollarization is becoming a structural macro force or remains a gradual evolution, tracking the pressures reshaping USD demand, reserve currency dynamics and cross-border capital flows. Through FX carry, reserve composition, Taylor Rule gaps and speculative positioning, the chart pack helps investors assess what a slower-moving transition could mean for currencies, rates and the broader global macro landscape.

Macro Trends explores how Powell’s Fed reshaped the modern macro landscape—tracking how repeated shocks, from COVID-era intervention to inflation-driven tightening, transformed rates, labor markets, Treasury markets and policy credibility. By examining Powell’s tenure through shifting Fed frameworks, balance sheet expansion and the repricing of inflation risk, this edition helps investors navigate a new era of monetary policy, market structure and macro uncertainty.

Macro Trends explores how today’s global energy shock is reshaping inflation risks, oil markets and macro resilience - tracking how the Iran crisis, extreme crude volatility and shifting U.S. energy independence are feeding through global markets, policy expectations and cross-asset dynamics to help investors navigate a more volatile macro landscape.

Macro Trends explores how China's growth reset, policy shifts, and strategic industrial push are reshaping global trade, capital flows, and cross-asset dynamic - helping investors navigate an evolving macro landscape.

Macro Trends explores how China's growth reset, policy shifts, and strategic industrial push are reshaping global trade, capital flows, and cross-asset dynamic - helping investors navigate an evolving macro landscape.

Macro Trends explores how rising geopolitical tensions and energy market disruptions are reshaping inflation risks, policy expectations and cross-asset dynamics, helping investors navigate an increasingly volatile global macro environment.

Macro Trends explores how shifting premia, fiscal uncertainty and policy divergence are reshaping rates, FX and sovereign risk, helping investors navigate a repricing global cycle.
This edition of Macro Trends explores rising metals volatility, with gold and silver absorbing shocks, industrial signals fragmented and inflation transmission diverging across regions.

This edition of Macro Trends explores Venezuelan crude’s potential return to U.S. markets, and how refinery limits and shifting trade flows may displace heavy grades rather than expand supply.

This edition of Macro Trends explores how financial conditions, growth, inflation and yield curve signals relate to forward equity returns and positioning across styles.

AI equities face a turning point as leadership narrows to hyperscalers and chipmakers with strong earnings, while rich valuations and uneven fundamentals reveal gaps between pricing and performance.

Markets have priced out a lasting easing cycle after the Fed’s hawkish cut, keeping policy near neutral as sticky inflation, high real yields and AI-led capex shape a carry-driven credit outlook.

With U.S. data dark during the shutdown, markets brace for a Fed cut as monetary easing collides with fiscal stimulus, reshaping yield curves and expectations for the policy path ahead.

Discover why gold has outperformed traditional assets in 2025. Macro Trends unpacks the forces behind its surge and shifting global investment dynamics.

This edition of Macro Trends explores the outlook for the Mexican Peso and Brazilian Real against the backdrop of a weakening US dollar, Fed easing, and shifting local dynamics.

In this edition of Macro Trends: France faces rising political and economic risks as government instability, deficits and weak growth push bond yields higher and weigh on equities.

Macro Trends: Shifting US Macro Dominance — Insights from Quant insight.

This week’s Macro Trends reviews the UK’s mixed backdrop: strong GDP and FTSE gains, but weaker jobs, higher inflation and steeper gilt yields, with the BoE signalling caution.

This edition of Macro Trends examines the global EV market, from China and EU leadership to shifting trade flows, Tesla’s sales pressure and rising battery costs reshaping automaker performance.

This week’s Macro Trends explores U.S. bilateral trade data, tariff impacts and the sharp slowdown at key U.S. ports, with the UK the only balanced trade partner.

This week’s Macro Trends breaks down the dollar’s steep YTD decline, its worst since the 1980s, driven by tariffs, debt fears and rate-cut bets, with support from GENIUS Act and Section 899 changes.

Rising Middle East tensions are rippling through global markets. This edition of Macro Trends tracks shifts in shipping, oil and equities with real-time data and clear analysis.

Trump’s return to the White House has been unconventional, and markets are reacting. This chart pack compares his early days with past administrations through data-driven analysis, not politics.

This chart pack explores how the ECB’s dovish shift is shaping expectations across rates, inflation, EUR/USD and equities, with timely data on cuts, dispersion and market reaction.
.svg)
This edition of Macro Moves examines how artificial intelligence is moving from innovation story to economic reality. Using hiring data, labor market indicators and proprietary analysis, it explores where AI adoption is gaining traction, which occupations are under pressure, and how the technology is reshaping workforce dynamics across the economy.

This edition of Macro Moves explores how the global fertilizer crisis has re-emerged as a critical macro story - where energy markets, Middle Eastern geopolitics and food security now intersect.

This edition of Macro Moves explores how renewed energy market disruptions are reshaping inflation dynamics and market behavior, as oil shocks revive comparisons to the 1970s. From stagflation risks and inflation patterns to cross-asset reactions and post-spike market performance, it reveals the data behind energy-driven volatility and the signals shaping today’s macro landscape.

This edition of Macro Moves explores how the S&P 500 really moves across days, months, and decades. From calendar effects and weekday patterns to drawdowns, market regimes, and the impact of missing the market’s best days, it reveals the data behind equity market behavior and the signals shaping long-term returns.

This edition of Macro Moves examines the US dollar’s decline and Europe’s innovation push, cutting through misleading metrics to reveal deeper volatility, structural gaps, and true macro signals.

This edition of Macro Moves explores muted crude oil price moves, analyzing supply shifts, spare capacity and futures curves to show how diversification and pre-priced risk are reshaping expectations into 2026.

This special edition chart pack offers a clear visual snapshot of global markets in 2025, highlighting key moves across assets, sectors, commodities, equities, the Magnificent Seven and the US dollar.

A fast, data-driven look at key market shifts shaping late 2025, covering New York’s housing change, Warren Buffett’s transition, Fed cut expectations, Bitcoin’s pullback and the Santa Claus rally.
.svg)
November 2025’s Macro Moves explores rare earth controls, a U.S. shutdown and market shocks, from China’s minerals grip to Bitcoin’s crash, gold volatility and Argentina’s reforms.

This edition of Macro Moves explores shifting global markets, from sovereign ratings and AI-led equities to institutional crypto, Macao’s tourism recovery and rising frontier market interest.

This edition of Macro Moves tracks currency momentum, yield curve shifts and equity signals, plus seasonality, U.S. real estate trends, Bitcoin correlations and daily insights on policy and trade.

This edition of Macro Moves explores gold’s resurgence, crypto volatility, shifting energy demand and climate risks, decoding trends in credit, equities and global trade with clear, actionable insight.

From electric vehicle inflation in Norway to record highs in global markets, this edition of Macro Moves highlight show data is adapting to a rapidly shifting world.

Exploring current economic or market topics through a unique lens, using interesting or underutilized data from the platform.
