


A faster path from question to insight.

Reimagining research for speed, scale, and collaboration.
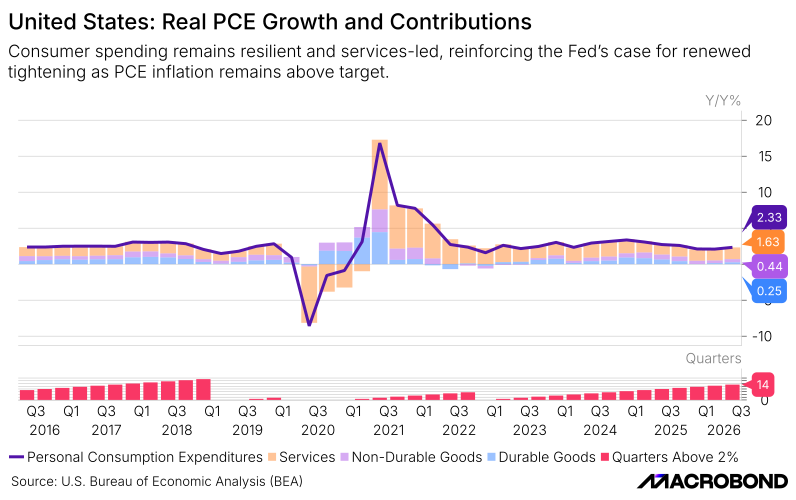
Fresh from the markets - our latest batch of financial insights released weekly.
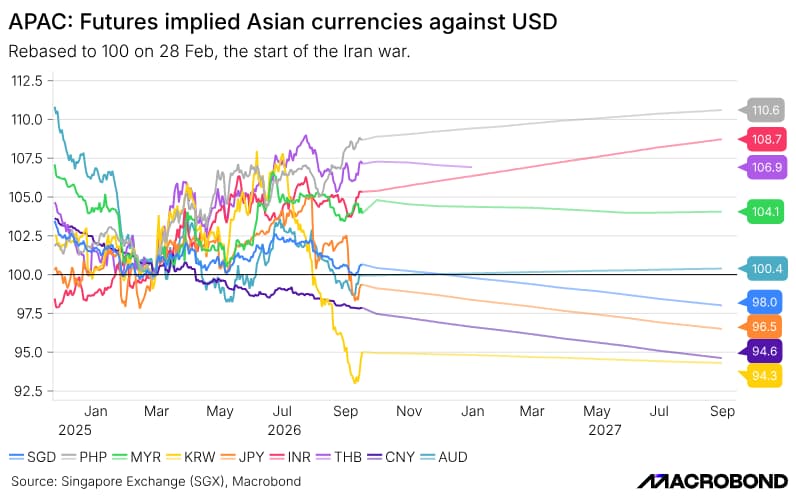
How did the February 2026 Strait of Hormuz closure affect APAC economies? Explore rising energy costs, producer prices and currency pressure across 10 markets—and why an AI export boom masked the impact.
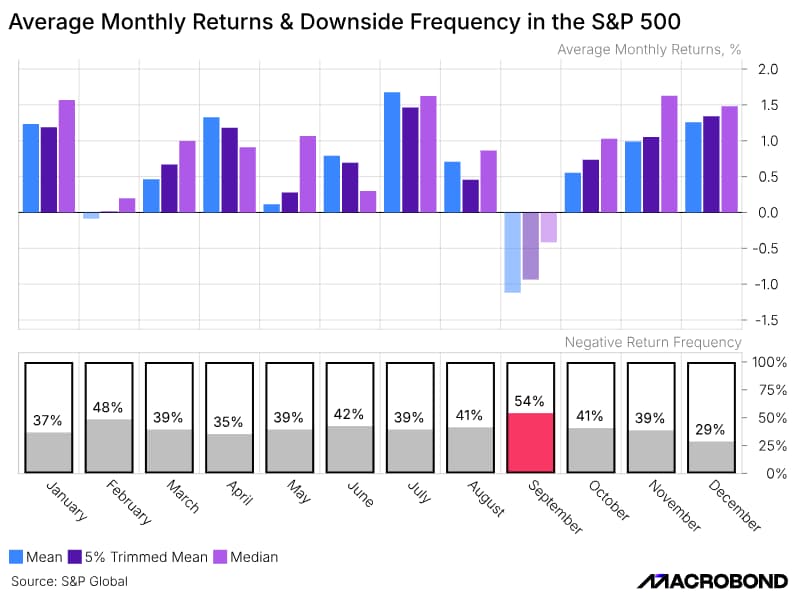
This edition of Macro Moves puts one of the market’s most persistent seasonal patterns to the test: the September effect. Drawing on nearly a century of S&P 500 history, the analysis examines whether September really is an unusually weak month for equities—or whether its reputation is simply the product of chance.
Using more than 20 measures of performance and risk, alongside different historical samples and evidence from equity markets around the world, the edition tests how consistently the effect holds up. It also explores the theories behind September’s weakness, whether the pattern creates an investment opportunity, and the surprising area where September stands out: its relationship with full-year market returns.

