Amplify

From flat charts to deep engagement, level up your research with Macrobond Amplify.

With explorable charts, transparent assumptions, and tangible usage metrics, Amplify helps research teams accelerate decision making and amplify their influence.
Amplify transforms static charts into an interactive research experience. One that is easier to share, more transparent, and sparks more valuable conversations and decisions.
For Producers
Amplify streamlines research publishing for economists, strategists, and analysts, protecting intellectual property while showing exactly how insights are consumed and used.
For Consumers
Amplify assets are explorable and responsive, allowing portfolio managers, CIOs, and decision makers to engage directly with the data, interrogate assumptions, and understand the thinking behind the research.
For Organizations
As economists and strategists publish into Amplify and decision makers engage with insights, it becomes a living knowledge base for research and investment teams, making relationships more discoverable, decisions more data driven, and alignment faster across the organization.

Make your insights interactive and ready for AI assisted exploration

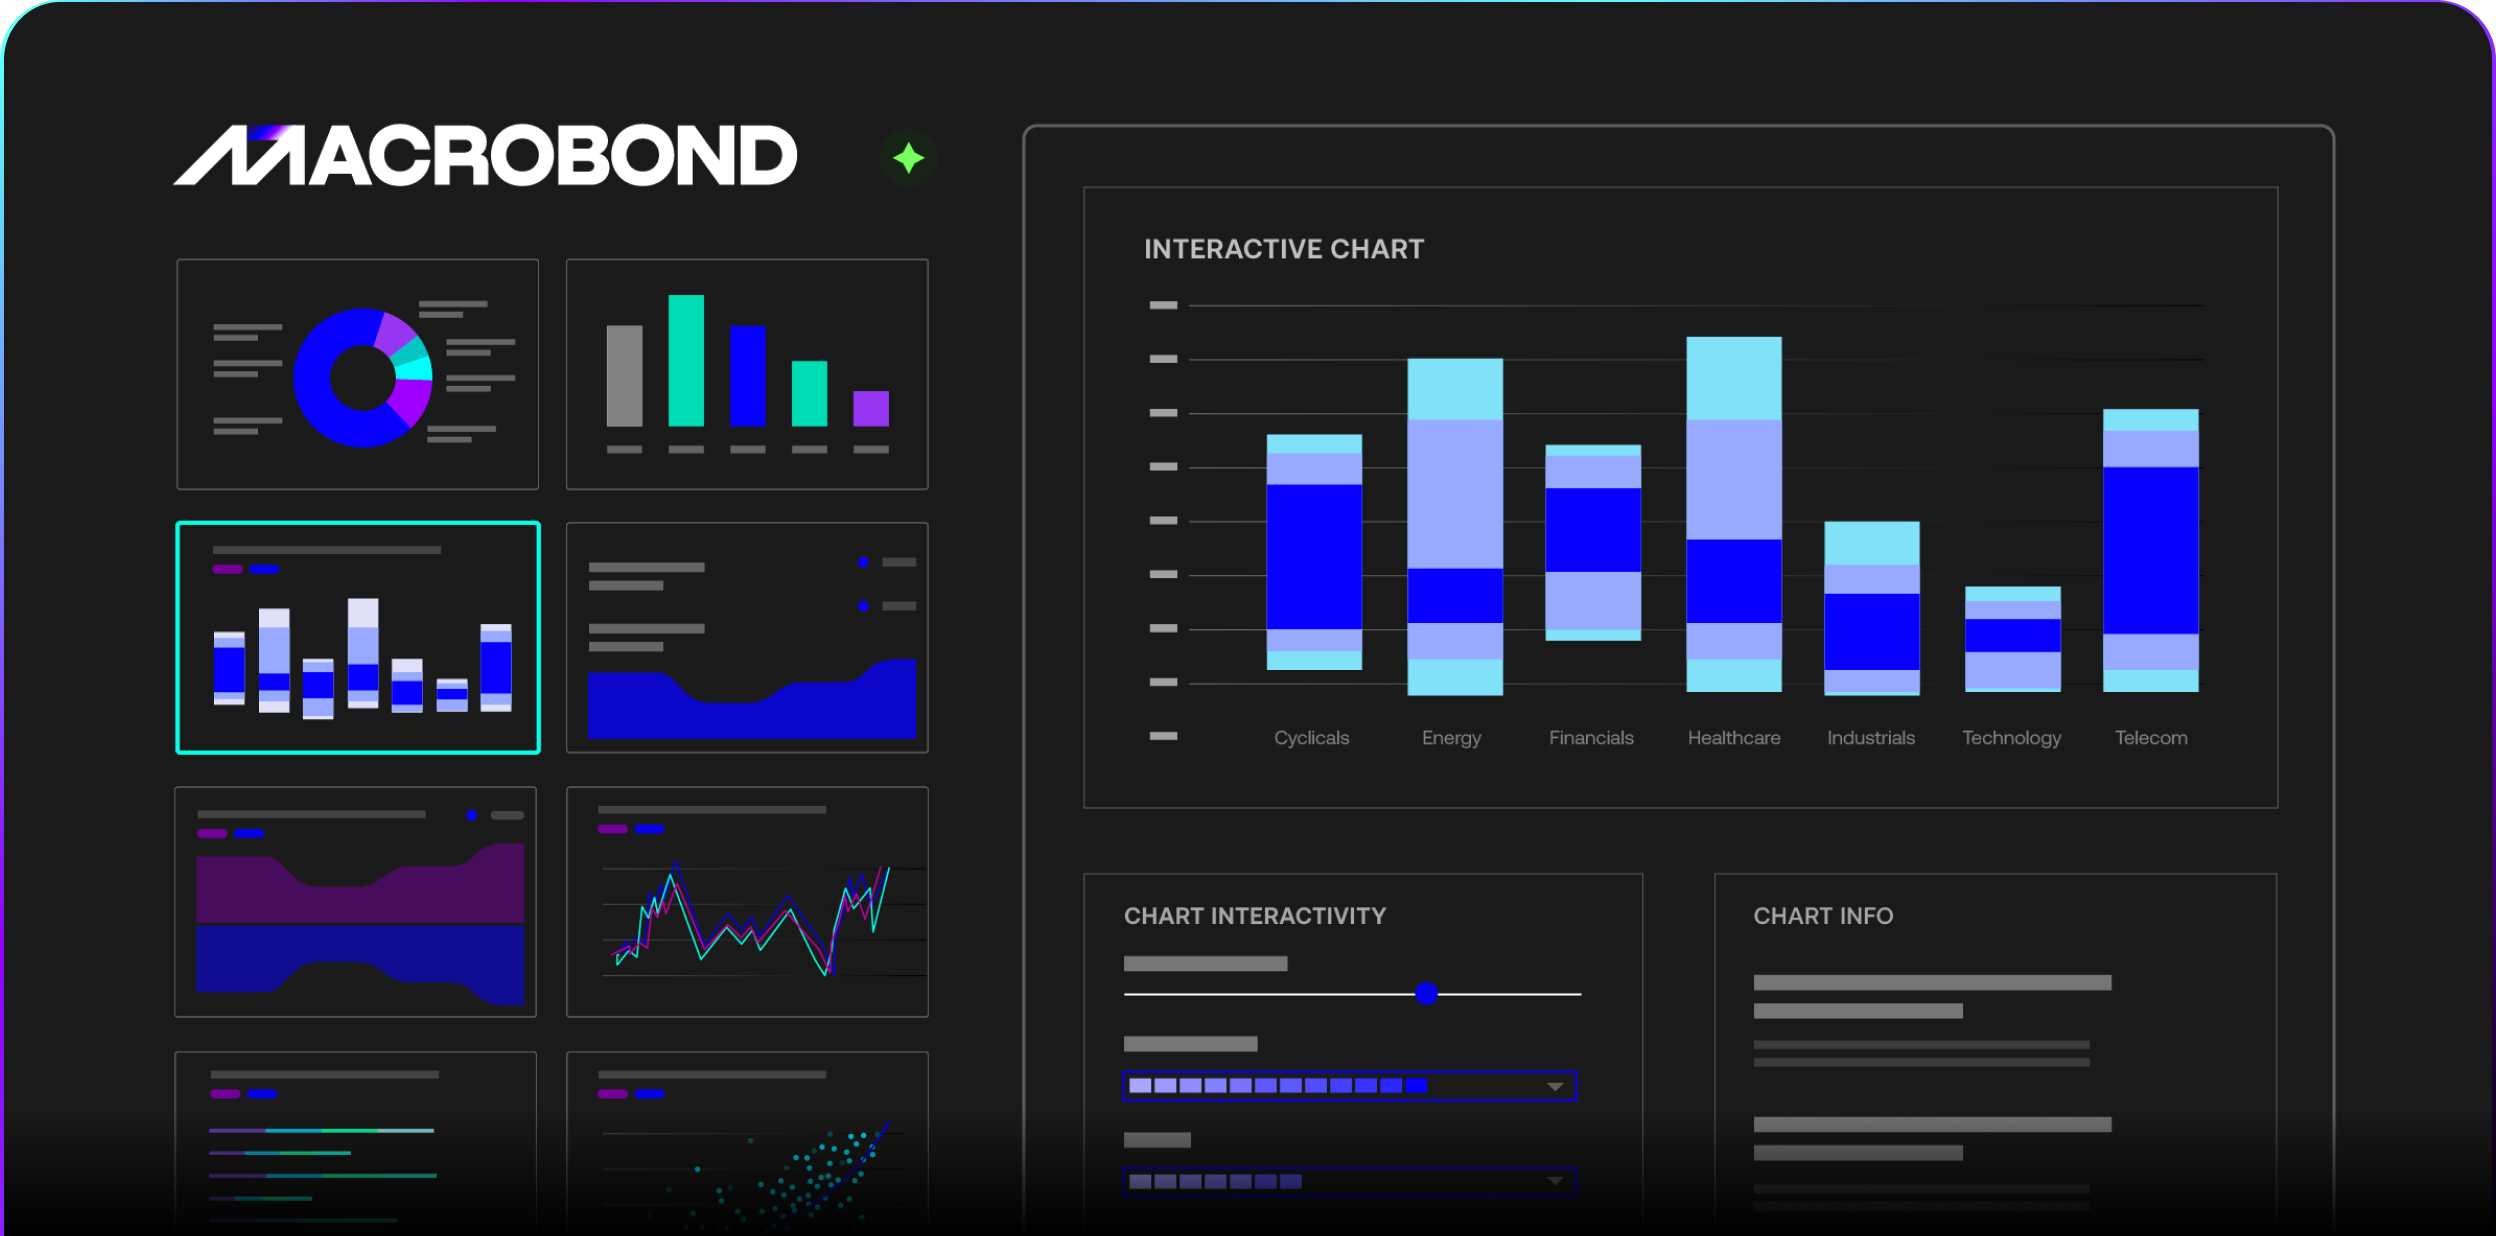
More than a chart, Amplify empowers teams to deliver a research experience—one with modern, dynamic charts that let users interact, explore, and engage with your insights directly in their browser.

Publish live, interactive charts from Macrobond Analysis
Use built in controls to define layouts, adjust appearance, and add context
People icon
Grant access and interactivity to different groups of users

Show the thinking behind every insight

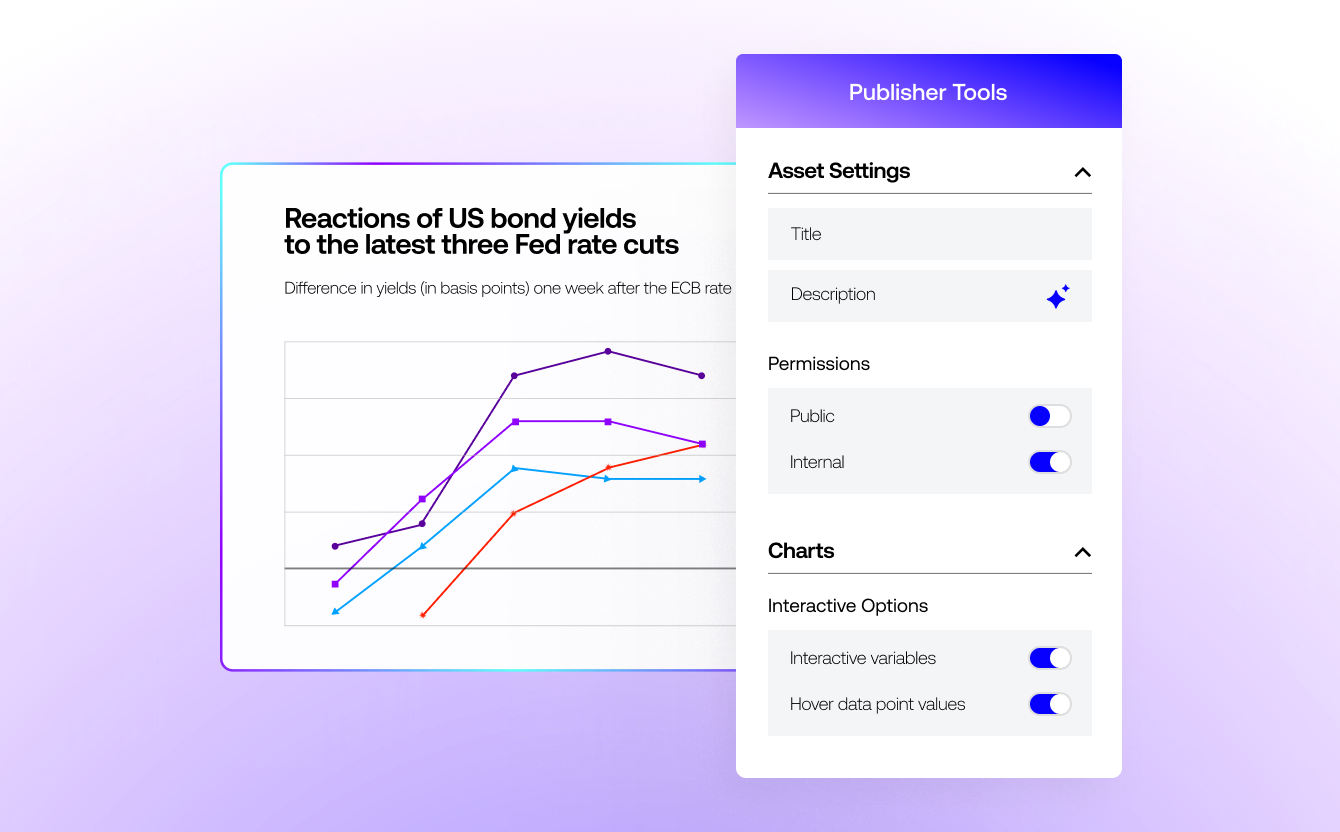
Amplify lets research teams move beyond charts to publish the model and thinking behind their analysis.

Interactive, responsive charts that allow consumers to explore your data and analyses
Adjustable variables like region and date range give consumers the ability to more deeply engage
The ability to connect with consumers directly 
in-chart via comments

Understand how your insights are used

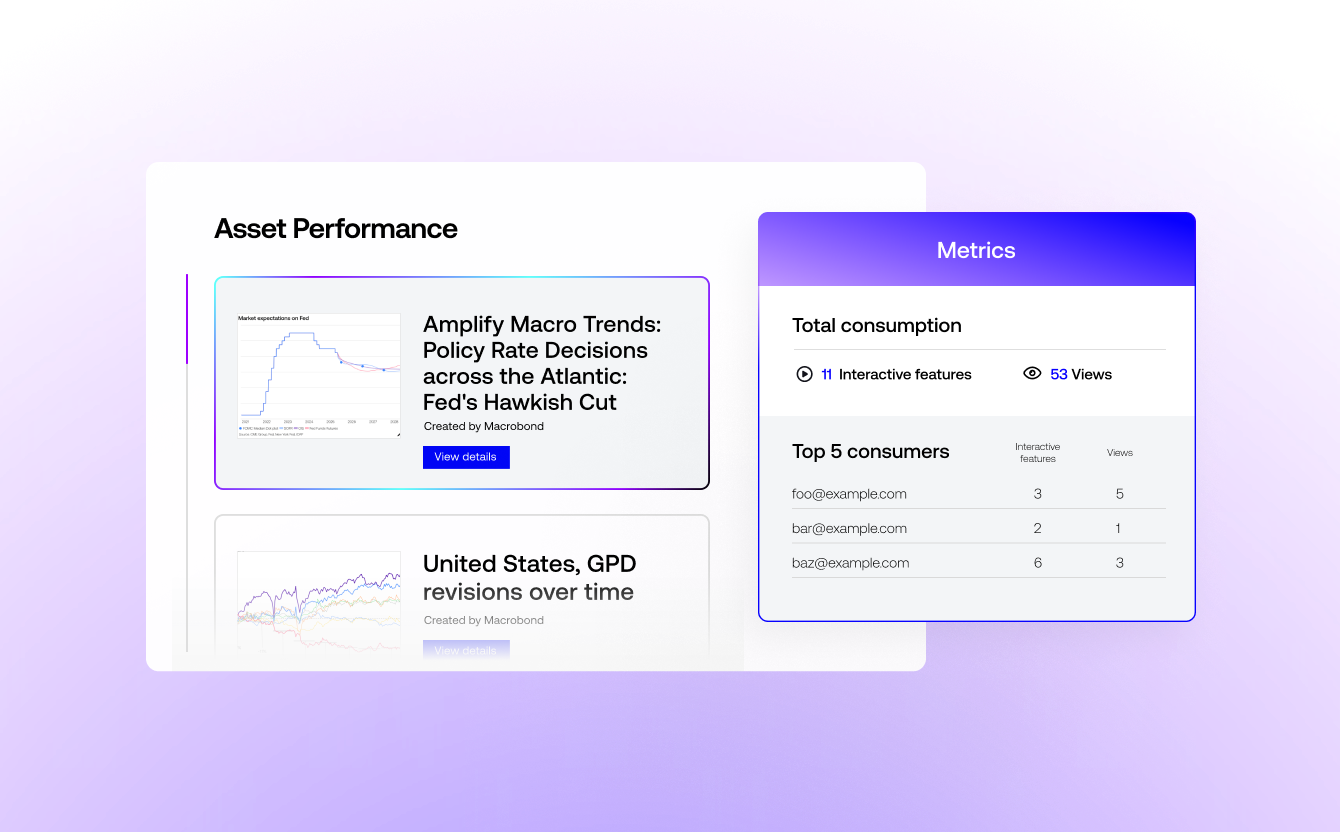
Amplify’s consumption metrics help economists, strategists, and asset managers understand how insights are used across teams, what resonates with portfolio managers and decision makers, and where analysis drives the most impact.

Can see viewership and interaction metrics with published reports, charts, and analysis
Inform their follow-up and conversations with clients and stakeholders based on their engagement
Surface related insights and analysis directly in Amplify via AI tools.

Amplify has increased the reach of our content nearly fivefold. But more importantly, it has given our team the ability to deliver to our stakeholders more useful, detailed insights that allow us to spend time discussing ideas and strategies, not debating fact.

Mick Grady
Head of Investment Strategy and Chief Economist, Aviva Investors