
When you’re securing retirement assets, you need reliable information, fast. Built for long-horizon investors, Macrobond helps you manage dense portfolios without adding headcount or cutting corners. Assess risk factors, track portfolio exposures, and test strategies to guide clients to more confident, informed decisions.
Project long-term outcomes with integrated time-series data and scenario modeling made for multi-decade investment strategies.
Fly through scenario analysis with no-code tools that support decades-spanning forecasts, without bouncing between spreadsheets – or port existing scripts directly into the platform.
Tighten up internal workflows and improve coordination across teams and stakeholders with a central location for data, models, and documentation.
Move past legacy systems and keep your analysis current, using tools built to handle changing markets, evolving regulations, and long-term investment demands.
A faster path from question to insight.
Reimagining research for speed, scale, and collaboration.
Fresh from the markets - our latest batch of financial insights released weekly.
This edition of Macro Trends examines the roots of the K-shaped U.S. economy, where strong headline growth and market performance can mask sharply different experiences across households. The analysis traces today’s divide through decades of data on productivity and real wages, the rising cost of necessities, consumer confidence, wealth concentration and asset ownership. It explores why gains from economic and equity market growth have accrued unevenly across income, wealth and generational groups—and how these structural differences help explain the widening gap between market performance and household sentiment.

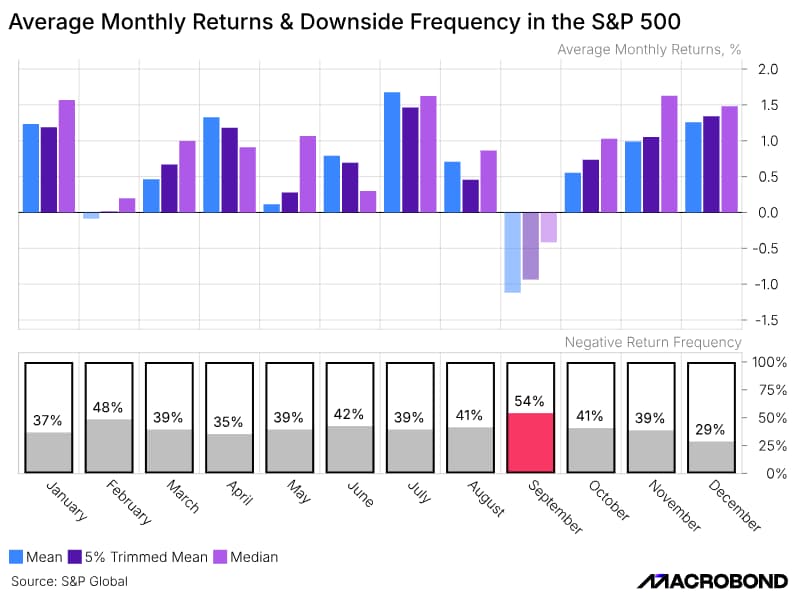
This edition of Macro Moves puts one of the market’s most persistent seasonal patterns to the test: the September effect. Drawing on nearly a century of S&P 500 history, the analysis examines whether September really is an unusually weak month for equities—or whether its reputation is simply the product of chance.
Using more than 20 measures of performance and risk, alongside different historical samples and evidence from equity markets around the world, the edition tests how consistently the effect holds up. It also explores the theories behind September’s weakness, whether the pattern creates an investment opportunity, and the surprising area where September stands out: its relationship with full-year market returns.