A bi-weekly look at the trends driving economies and investments worldwide.



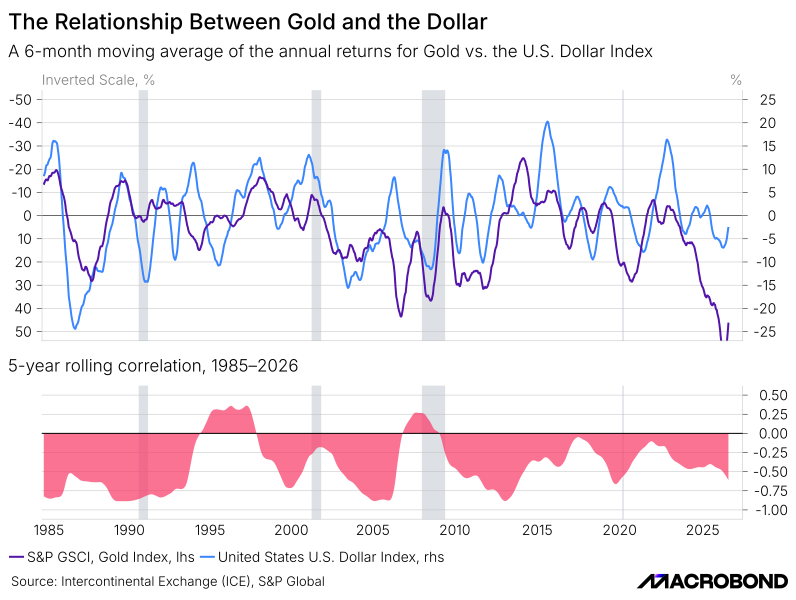
Gold's Negative Correlation With the Dollar Holds Most of the Time, Not All of It: Gold has moved largely opposite the U.S. Dollar Index since breaking from its fixed peg in 1971, and that negative correlation is what allows gold to function as a portfolio counterweight to dollar weakness. The relationship reversed for extended periods in the mid-1990s and mid-2000s, meaning the hedge is regime-dependent rather than something investors can assume holds at all times.
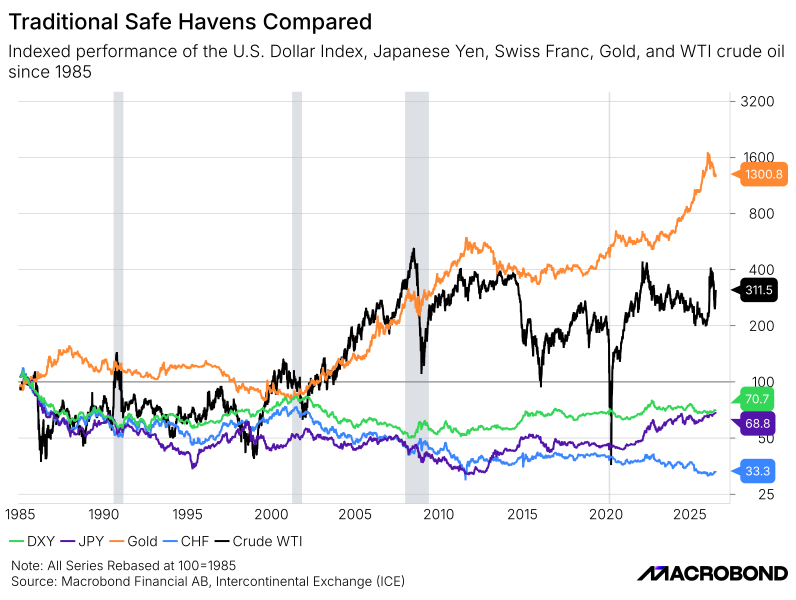
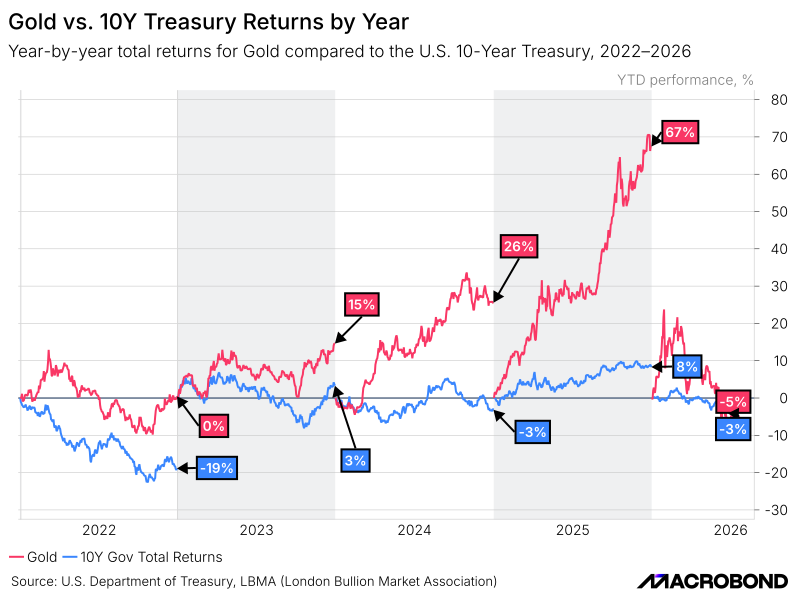
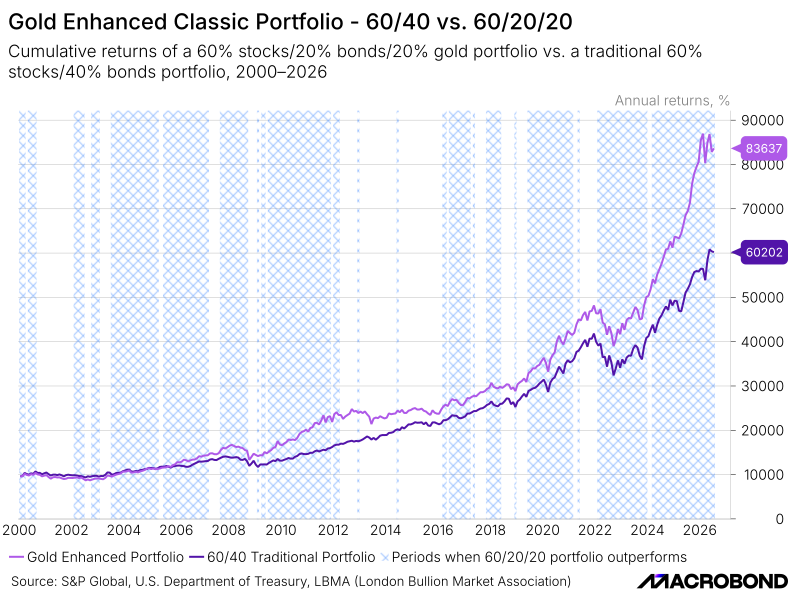
In recent years, gold has outperformed other safe haven assets: Gold trades at one of its widest premiums to silver and platinum in over a century, has beaten the 10-Year Treasury in every year but one since 2022, and has outpaced the yen, franc, and dollar index by a wide margin since 1985. Within a standard 60/40 portfolio, adding a gold allocation has added meaningfully to returns since 2022–23, though the gains concentrate in periods of inflation and bond weakness rather than holding evenly across every regime.
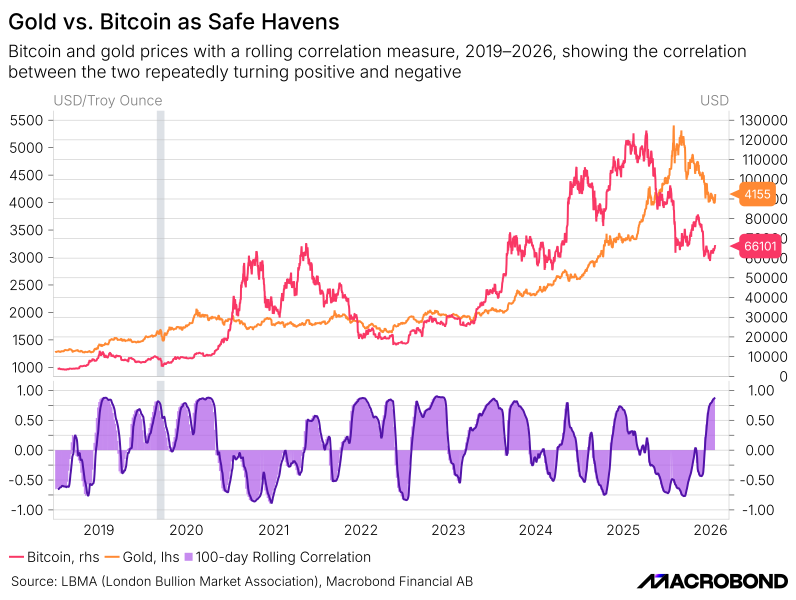
Bitcoin sometimes tracks gold during crises but its relationship is unstable: Gold and Bitcoin have both appreciated substantially, and their correlation turns positive during select periods, including 2024–25. That correlation reverses with similar frequency, meaning Bitcoin behaves as a separate, higher-volatility risk asset that occasionally aligns with crisis-driven gold demand rather than a dependable substitute for gold's safe-haven role.
Insights
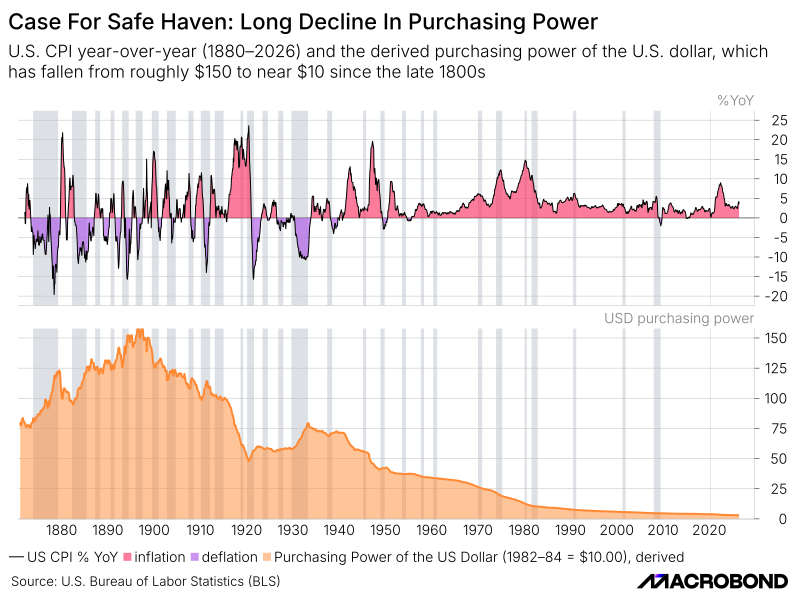
Before 1950, deflationary stretches were common (the CPI line dips below zero repeatedly, especially in the 1920s–30s). After 1950, deflation essentially disappears. Inflation becomes structural, not cyclical. The bottom panel is the real story: a dollar's purchasing power has been ground down almost continuously since the creation of the Federal Reserve (1913) and especially after Bretton Woods ended in 1971.
Insights
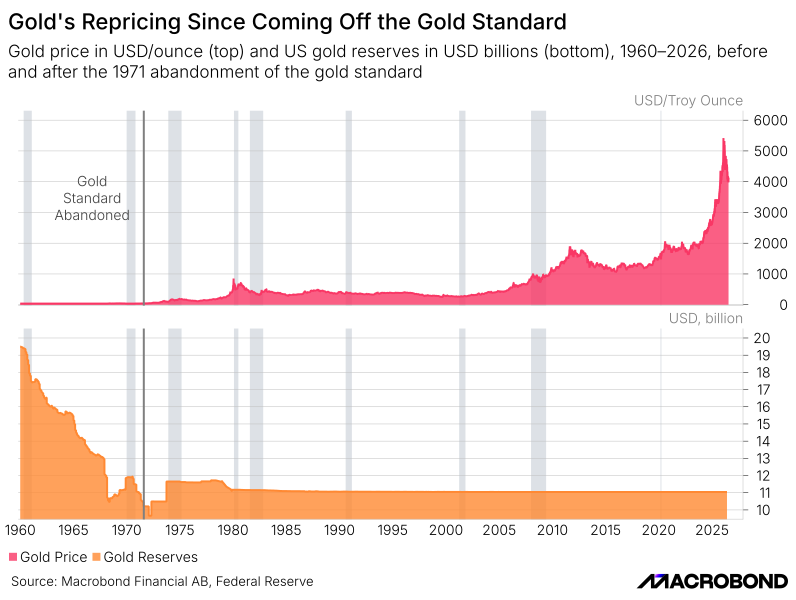
Before 1971, gold was pegged (~$35/oz), so the price line is flat. After 1971, gold floated and rose from under $100 to over $5,000/oz, steepest in the last few years. The bottom panel stays flat around $11 billion despite that rise because U.S. official gold reserves are booked at a statutory fixed price of $42.22/ounce, set by law in 1973 and never updated. Physical holdings (~261 million ounces) have barely changed (the flat line reflects a fixed accounting convention, not reserves being sold off or failing to keep pace with the market price above it). Top panel = market value; bottom panel = statutory book value — different measures, not two versions of the same number.
Insights
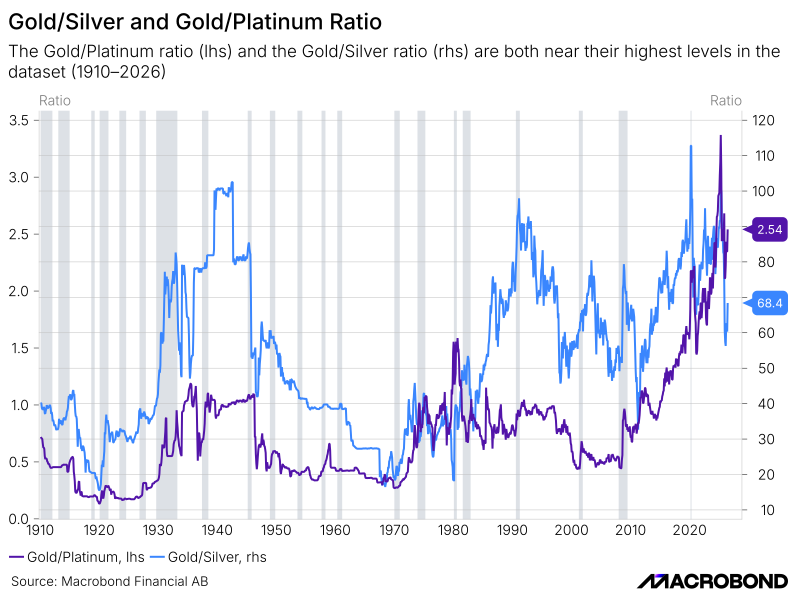
Silver and platinum are priced mainly as industrial commodities (electronics/solar, catalytic converters); gold is priced as a monetary asset. The ratios track that divergence across three eras: they move together through the 1910s–60s, driven by shared wartime and monetary shocks; gold/silver breaks away after 1971 once gold floats free of its peg, while gold/platinum stays contained since platinum still rivalled gold in jewellery and industrial use (platinum even traded above gold for long stretches); and since roughly 2015–2020, both ratios have surged to record highs as platinum's industrial demand shrinks and gold's monetary demand accelerates. The result is one of the widest gold premiums over its metal peers in over a century.
Insights
The top panel shows 6-month moving average annual returns for gold vs. the U.S. Dollar Index, with gold's axis inverted so the two lines appear to move together visually even though they're moving oppositely in real terms. Gold and the dollar are inversely related most of the time, not always. If one is holding dollar-denominated assets (which most portfolios are, by default), a falling dollar erodes their real value. An asset that reliably rises when the dollar falls offsets that. Here, gold is protecting against a decline in the currency itself, which is the more direct threat to a dollar-based investor. The negative correlation is what makes gold structurally useful as a counterweight in a dollar-heavy portfolio, rather than just something that happens to also go up.
Insights
Year-by-year YTD total return comparison between gold and the U.S. 10-Year Treasury, from 2022 through early 2026. In 2022, bonds lost value while gold was roughly flat (0%), a rare divergence during a rate-hiking shock. From 2023 onward gold has beaten Treasuries every year, with the gap exploding into 2025–26. This directly challenges the old assumption that government bonds are the default "safe haven", it shows gold has been the more effective store of value and portfolio ballast in the recent inflationary/rate environment.
Insights
Bitcoin and gold have both risen substantially, and at times move together (positive covariation, e.g. 2024–25), but the relationship flips negative repeatedly, meaning Bitcoin doesn't reliably behave like a safe haven the way gold does — it is better characterized as a separate, higher-volatility risk asset that sometimes correlates with crisis-driven gold buying and sometimes decouples entirely.
Insights
The gold-enhanced portfolio tracks closely with the traditional 60/40 through the 2000s and 2010s, but pulls decisively ahead starting around 2022–2023, and the gap widens sharply into 2025–26. The shaded bands mark periods the 60/40 actually outperforms. It shows gold isn't a free lunch in every regime, just adds value over the full cycle, particularly during periods of inflation and bond weakness.
Insights
The traditional safe-haven currencies (yen, franc) and the dollar index itself have been essentially flat-to-declining over 40 years, while gold has risen roughly 20x. Crude oil is volatile but not a safe haven — included in this chart as a contrast (a real, cyclical commodity rather than a store of value). Oil shocks (1970s oil crisis, 2008, 2022) often coincide with inflation fears or geopolitical stress, the same triggers that drive gold buying. So there are moments the two lines move together, but it's coincidental co-movement from a shared trigger (inflation/geopolitics), not oil behaving as a store of value itself.