A bi-weekly look at the trends driving economies and investments worldwide.


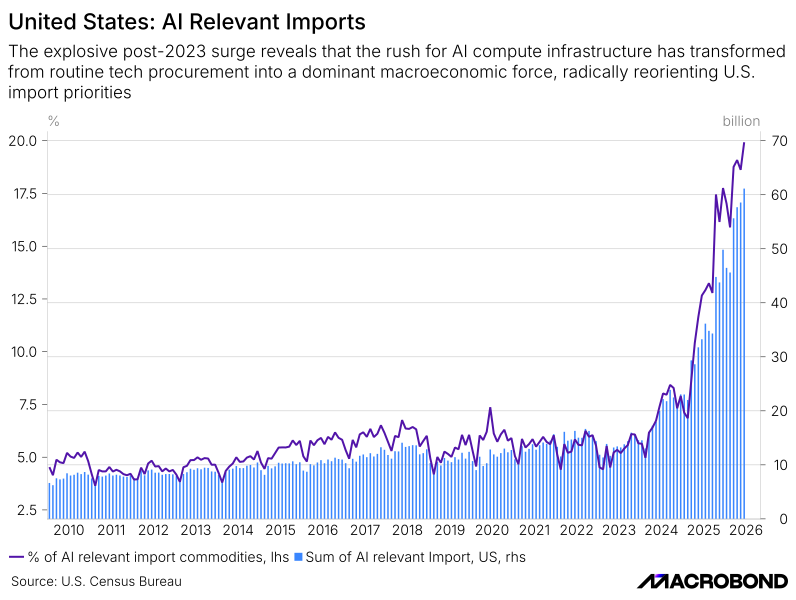
Data center construction is fueling a jump in U.S. tech hardware imports: The AI boom starts with something physical, not financial. All the new data centers going up are the real driver behind rising U.S. imports of specialized tech hardware. That grounds the whole cycle in actual activity on the ground before any of it shows up on balance sheets or in markets.
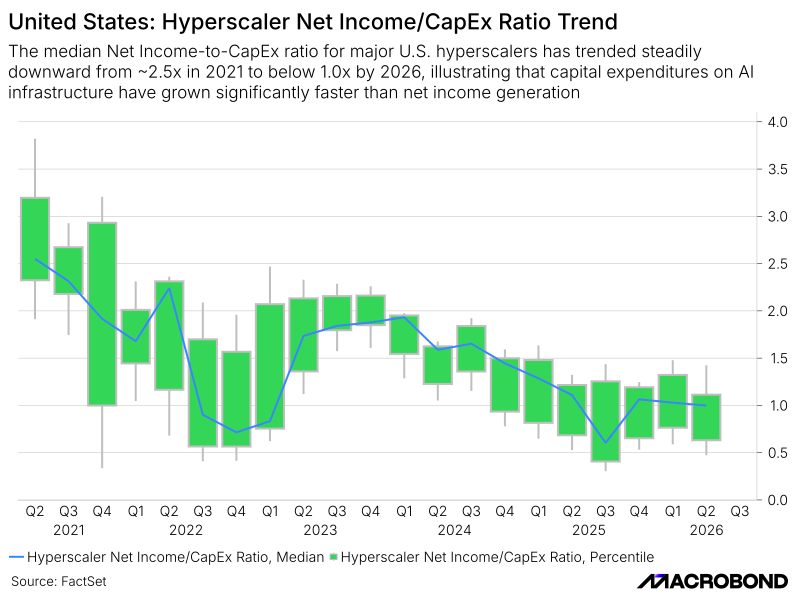
Hyperscalers are pouring basically all their net income back into capex: From there, the demand flows straight into how these companies behave, with hyperscalers plowing nearly every dollar of net income into capital spending. That's where the physical build-out starts showing up in the financials.
Semiconductor stocks are volatile and the tech risk premium is thin, so pricing hinges on execution: All of this eventually spills into the broader market, driving big swings in chip stocks and squeezing the tech sector's equity risk premium. The upshot is a market where pricing is very sensitive to whether companies keep delivering, which closes the loop from physical demand back to financial markets.
Insights
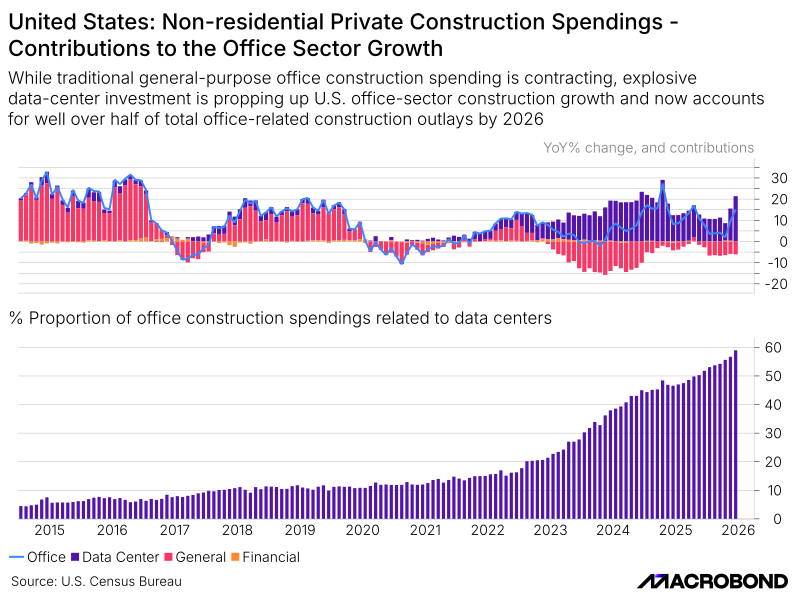
While traditional general office spending continues to contract, explosive data center investment has stepped in to single-handedly sustain the sector, expanding to represent roughly 60% of total office-related construction spending by 2026. This surging physical footprint acts as the critical leading-edge indicator and upstream demand engine for AI infrastructure—establishing the specialized physical capacity, power, and cooling facilities required before high-performance computing hardware, chips, and servers can be imported and deployed at scale.
Insights
This chart illustrates a profound shift in U.S. trade structure: after hovering near a ~5% baseline for over a decade, AI-relevant commodities expanded vertically post-2023 to approach 20% of total U.S. imports—exceeding $60 billion monthly by mid-2026. This exponential growth was directly driven by upstream data center construction demand, as the rapid expansion of physical facilities, power networks, and specialized space created an immediate requirement to fill those sites with advanced GPUs, servers, and networking hardware. Consequently, domestic physical infrastructure development served as the primary catalyst for this massive influx of high-tech imports, reshaping overall macroeconomic trade flows in the process.
Insights
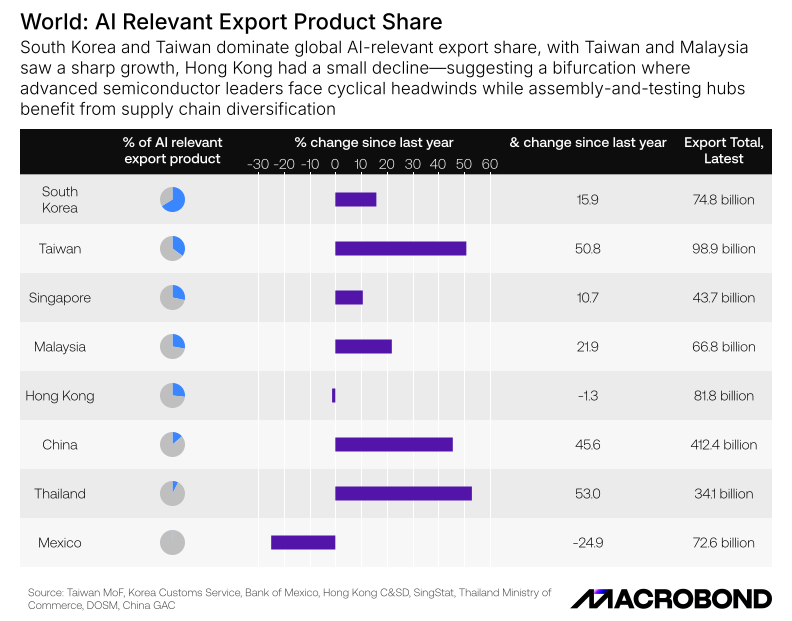
The concentration of AI-relevant products in South Korea and Taiwan’s export portfolios underscores how heavily these economies have pivoted their manufacturing bases toward the global AI hardware supply chain. For global markets and supply chain strategists, the "so what" is twofold: it highlights an extreme geographical reliance on East Asia for critical AI components, while simultaneously showing that manufacturing hubs like Thailand are rapidly positioning themselves as essential secondary suppliers to diversify risk. Ultimately, as AI technology becomes the primary engine for tech sector growth, countries with high AI export concentrations will capture a disproportionate share of tech revenues, but they also face heightened vulnerability to shifts in global AI demand and geopolitical trade friction.
Insights
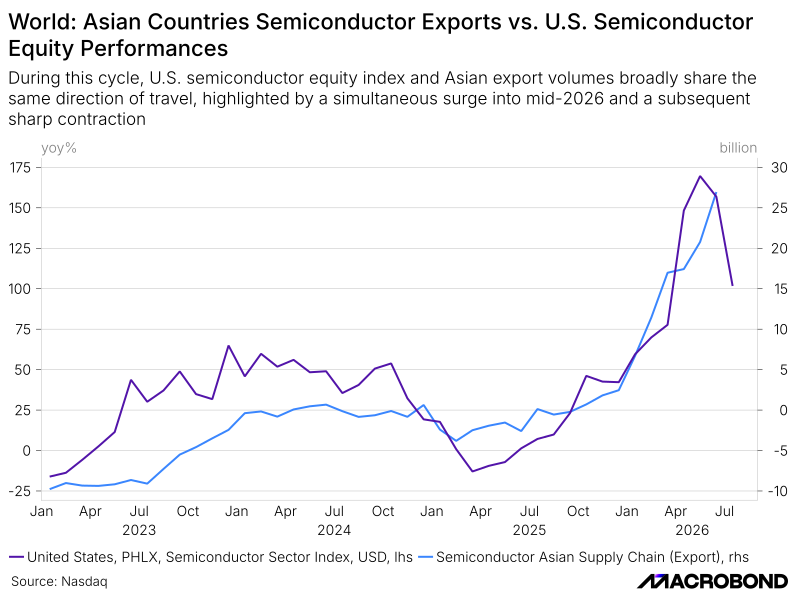
This tight alignment demonstrates that U.S. semiconductor equity valuations were directly anchored to physical shipment data from Asian supply chains throughout this expansion cycle. The simultaneous sharp drop off the peak illustrates how rapidly both equity markets and export volume metrics retrace after an extreme acceleration phase—reflecting factors like base effects, inventory recalibration, or shipment timing—without necessarily signaling a shift in underlying end demand. Ultimately, it highlights that financial market pricing and physical supply chain flows remain tightly synchronized during major cyclical swings.
Insights
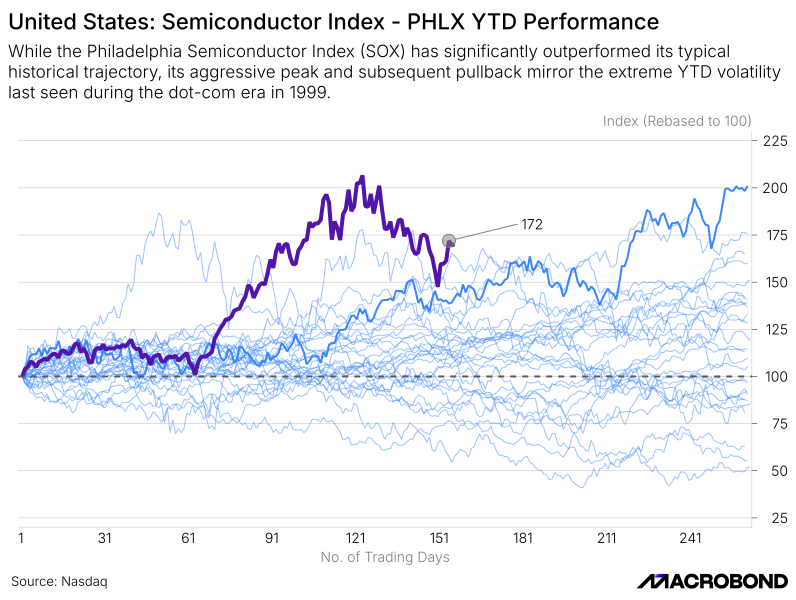
During the first half of 2026, the Philadelphia Semiconductor Index (PHLX) experienced an unprecedented rally—surging past almost 200% YTD performance within just ~240 trading days—outperforming almost every historical trajectory in the chart before entering a swift consolidation.
When a major structural shift occurs—whether the internet boom in 1999 (larger blue line) or the current AI buildout—investors aggressively price in future growth early in the year, pushing the index far above its typical historical band. Going forward, we should expect elevated volatility rather than smooth upward linear gains; while underlying long-term demand remains intact, rapid price surges often trigger sharp, mid-year consolidations as the market periodically pauses to calibrate valuations with actual earnings and execution.
Insights
Currently sitting at 0.0% (0.04%), the U.S. large-cap technology sector's Equity Risk Premium (ERP) rests near -2 standard deviation extremes and far below its post-2010 mean, signaling that investors are demanding virtually no excess return over risk-free Treasuries for holding tech equities. This valuation capstone directly reflects the massive wave of upstream demand—where surging data center construction has driven unprecedented AI import volumes—now being fully capitalized into equity prices with virtually no buffer over risk-free Treasuries. With no margin of safety left, any deceleration in this upstream capital deployment, unexpected rate pressure, or quarterly monetization miss leaves the sector exceptionally vulnerable to heightened volatility and a sharp repricing back toward historical risk norms.
PLEASE NOTE: THIS CHART USES 3rd PARTY DATA VIA MACROBOND, PLEASE REACH OUT TO YOUR ACCOUNT TEAM IF YOU CANNOT ACCESS THEM IN THE APP.
.svg)
Insights
The convergence of the median Net Income-to-CapEx ratio toward 1.0 suggests a structural transition from the historically high-margin, asset-light software model toward an intensely capital-heavy buildout phase. While this sustained investment demonstrates strong strategic conviction in long-term AI demand, it compresses free cash flow margins and reduces financial flexibility, putting heightened pressure on these tech giants to deliver visible revenue monetization from their AI services to justify CapEx remaining at or nearparity with net income.
PLEASE NOTE: THISCHART USES 3rd PARTY DATA VIA MACROBOND, PLEASE REACH OUT TOYOUR ACCOUNT TEAM IF YOU CANNOT ACCESS THEM IN THE APP