A bi-weekly look at the trends driving economies and investments worldwide.



We are witnessing a K-shaped economy: Growth and asset performance are no longer moving together for all households —one segment of the population is doing better than before, while another is stagnating or falling behind, and the two paths are diverging rather than converging.
A K-shaped economy means the top and bottom of the income and wealth distribution are on visibly different trajectories: Asset owners have kept pace with or outrun inflation and market gains, while wage earners, (particularly at the lower end) have seen their pay and purchasing power stall or erode over the same period.
This split is due to decades of structural change: real pay decoupled from productivity growth in the mid-1970s, the cost of necessities has outpaced wages for lower earners since, and the resulting wealth gap has stayed essentially unchanged for 35 years because ownership of equities — the asset class driving most market gains — remains heavily concentrated at the top.
Insights
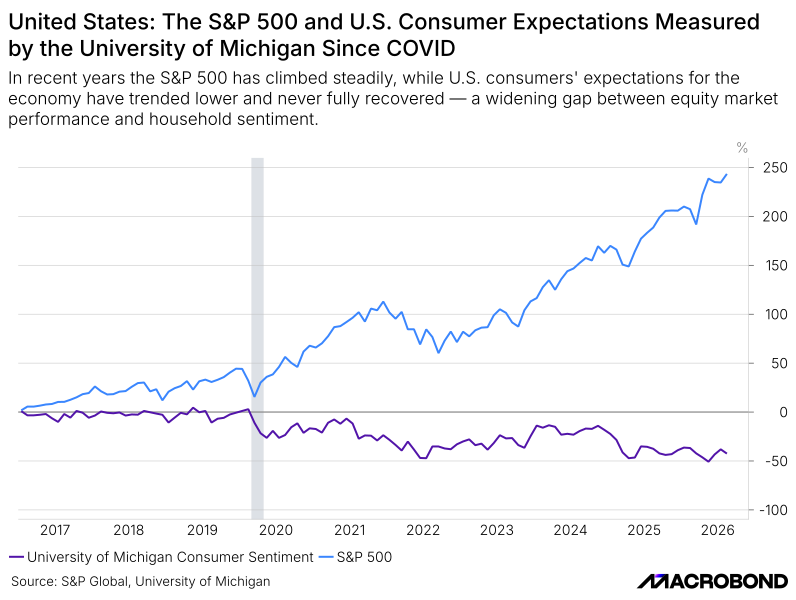
The S&P 500 has risen roughly 240% since 2017 lows, while University of Michigan consumer sentiment has remained well below its pre-COVID level for most of that stretch. The two series moving in opposite directions for years, rather than just diverging briefly around a shock, is consistent with the asset-ownership skew shown earlier in this deck rather than a temporary mood swing.
Insights
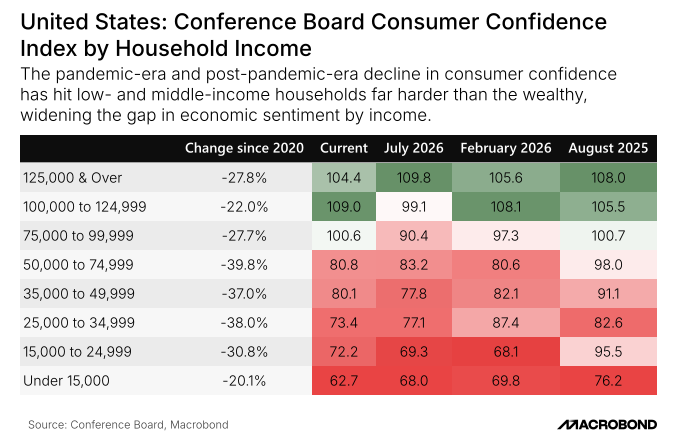
Households earning under $35,000 remain 30–40% below their 2020 confidence readings, while households earning over $100,000 have returned close to 2020 levels. Splitting the headline confidence number by income shows that the market/sentiment gap in the previous chart is concentrated almost entirely among lower-income households, not spread evenly across the population.
Insights
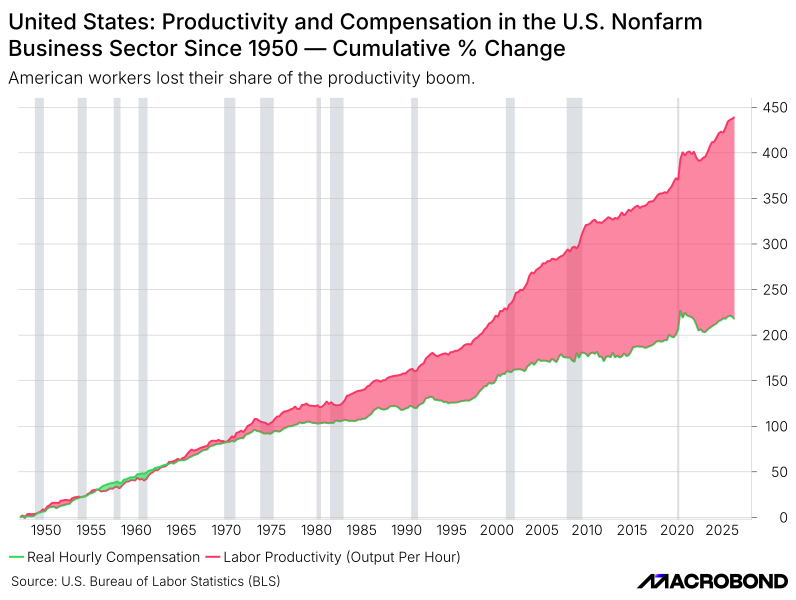
Labor productivity and real hourly compensation tracked closely from 1950 through the early 1970s, then diverged sharply as productivity kept compounding and pay growth stalled. The split has never closed since, and it sets the baseline for why real wages, necessity costs, and wealth shares in the rest of this deck all move the way they do.
Insights
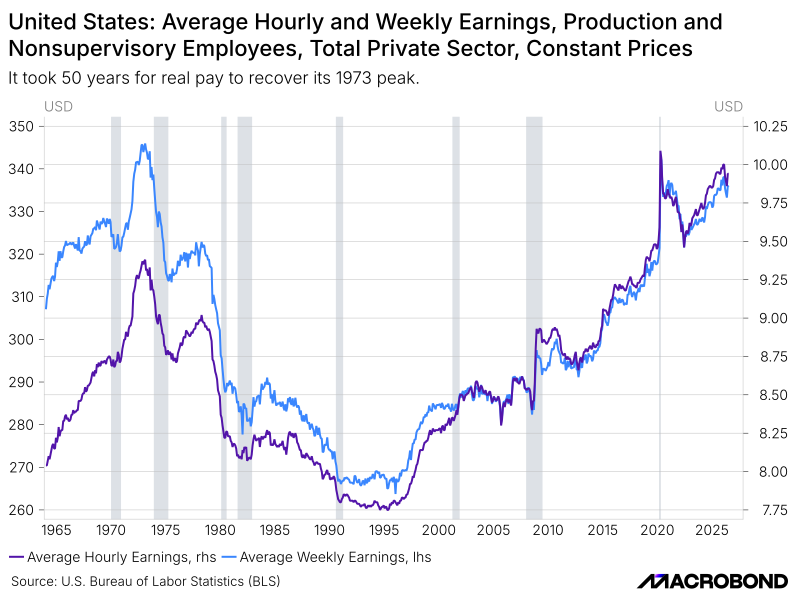
Real hourly and weekly earnings peaked in 1973, spent most of the following five decades below that level through repeated recessions, and only broke out to sustained new highs after 2020. A worker earning the inflation-adjusted average wage today is only modestly better off than one in 1973, despite the economy having grown many times over in the interim.
Insights
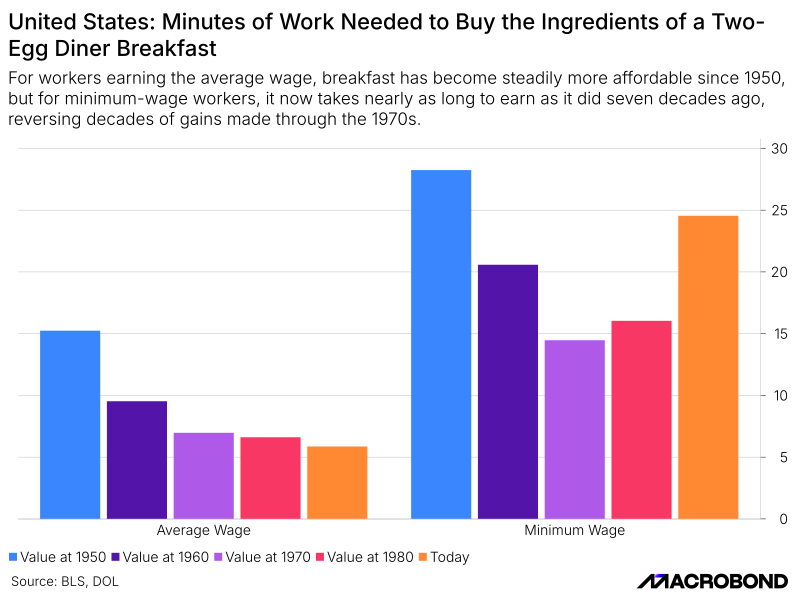
At the average manufacturing wage, the time needed to earn a diner breakfast fell steadily from 15 minutes in 1950 to about 6 today, a clear affordability gain. At the minimum wage, the same breakfast (2 eggs, 3 pieces of bacon, 2 slices of bread, 1 tbsp of butter, 1 cup of coffee and 1 glass of milk) got cheaper through the 1970s but has since drifted back up toward 25 minutes — nearly the 1950 level — meaning low-wage workers have given back most of the ground gained over the past 70 years.
Insights
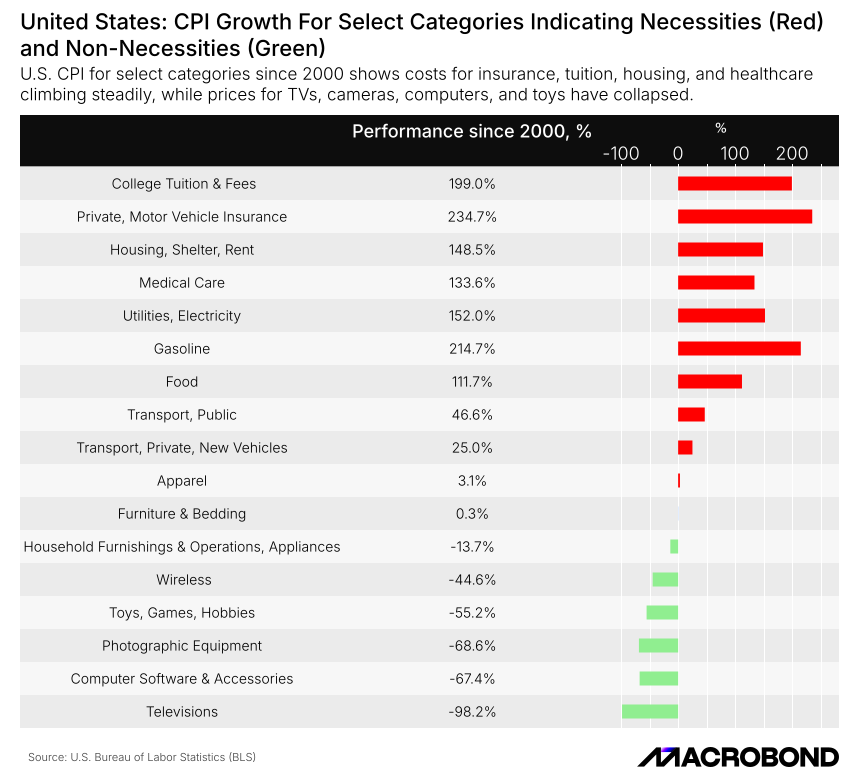
Since 2000, prices for motor vehicle insurance, tuition, housing, and medical care have risen 130–235%, while prices for TVs, cameras, and computer software have fallen 55–98%. Because necessities take up a much larger share of a lower-income budget, this divergence in relative prices hits the bottom of the income distribution far harder than the CPI headline number suggests.
Insights
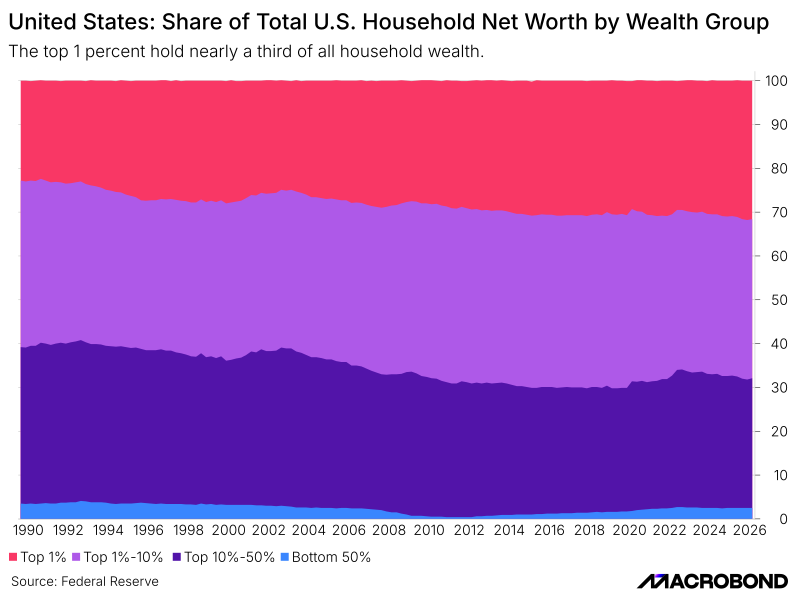
The top 1%'s share of household net worth has stayed in a narrow band around 30% every year since 1990, largely undisturbed by the dot-com crash, the GFC, or COVID. The bottom 50%'s share has stayed pinned near 2–3% over the same 35 years, which suggests the concentration is a structural feature of how wealth is held, not a by product of any one downturn or recovery.
Insights
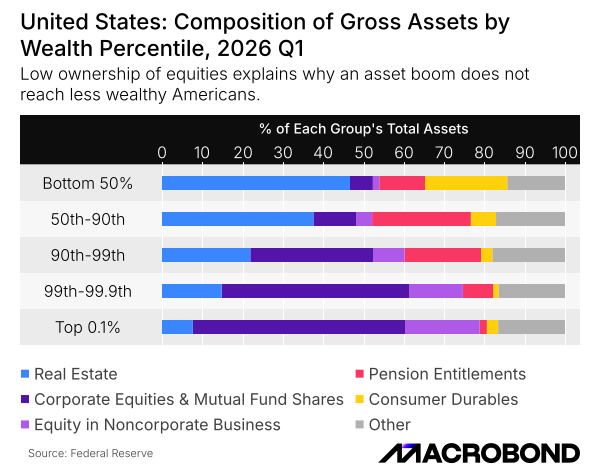
The bottom 50% hold roughly 45% of their assets in real estate and only a small single-digit share in corporate equities, while the top 0.1% hold the majority of their assets in equities. That asset mix is the mechanical reason equity market rallies — like the S&P 500 gains later in this deck —translate into wealth gains mostly for households that already have the most.
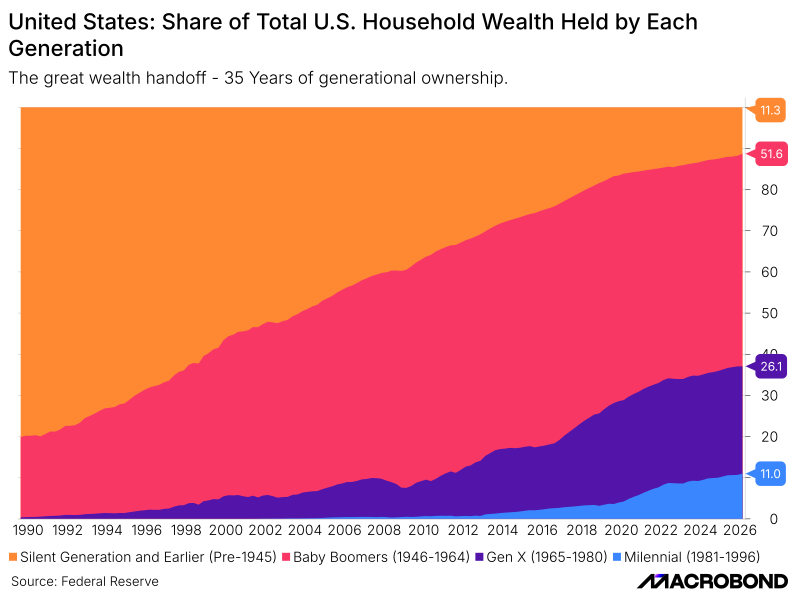
Baby Boomers still hold 51.6% of household wealth against Gen X's 26.1% and Millennials' 11.0%, even as the oldest Millennials turn 45 this year and enter their historically highest-earning decade. The generational transfer ofwealth already underway will shift some of these shares over time, but for now the gaps are significant.
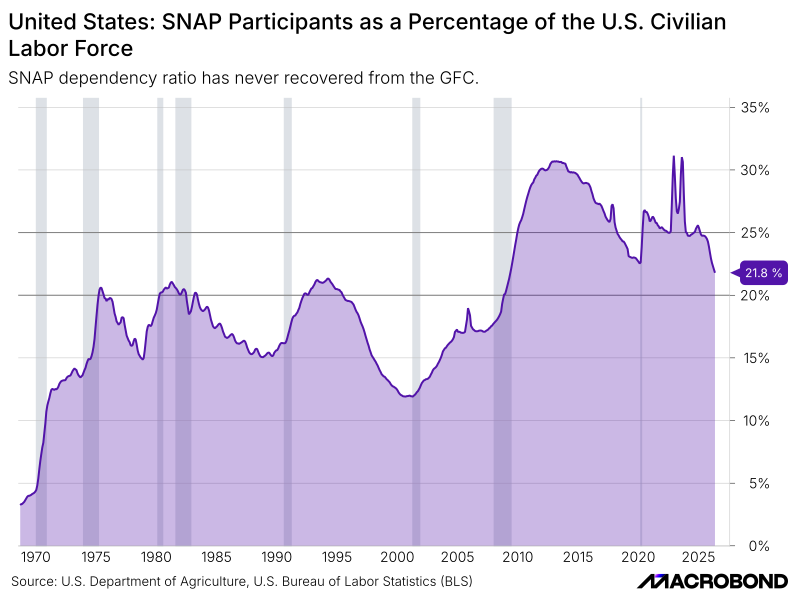
SNAP participation as a share of the labor force peaked above 30% after the 2008 financial crisis, eased through the 2010s expansion, but has stayed above roughly 22% ever since and sits at 21.8% today. That's still well above the pre-2008 range of 12–17%, indicating that a meaningful slice of the labor force never regained the footing it lost in that recession.