

A bi-weekly look at the trends driving economies and investments worldwide.



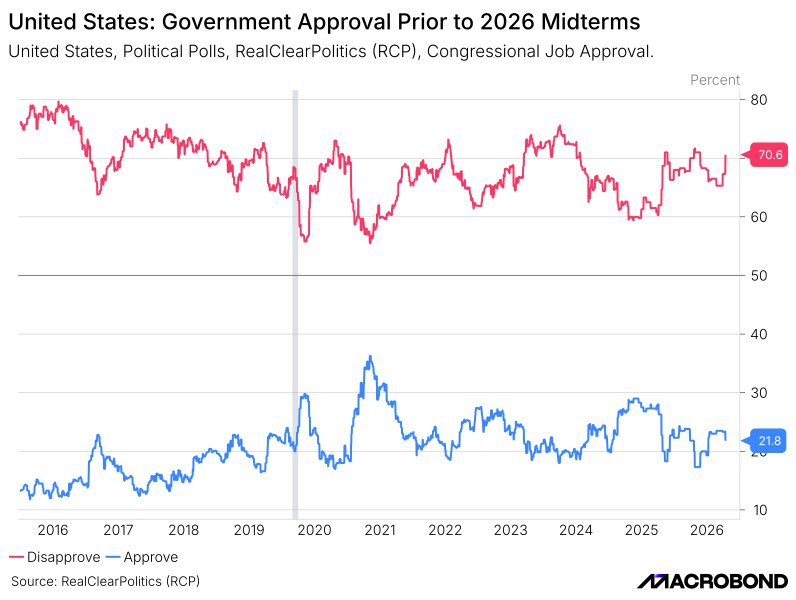
Strong Data, Weak Mood: The November 3rd midterms are three weeks away, and the economy looks better on paper than it feels to voters. Stocks are up in the low teens, real wages are rising in every state, GDP is growing in most battlegrounds, and the misery index sits well below past stress points. Yet consumer sentiment is near record lows, majority of Americans say the country is on the wrong track, and Congress’s approval is stuck around 23%. The hard data is not what voters are reacting to.
Prices Are the Issue: What households feel is the cost of living. Gasoline is up roughly 45% since the Iran war began, the 30-year mortgage rate has climbed back to 7.4%, and small-business sales are running below last year. Each reaches voters differently, through the pump, the closing table and the local shop. Rising wages and portfolios help, but they are unevenly felt, so they have not offset a squeeze that is visible every day.
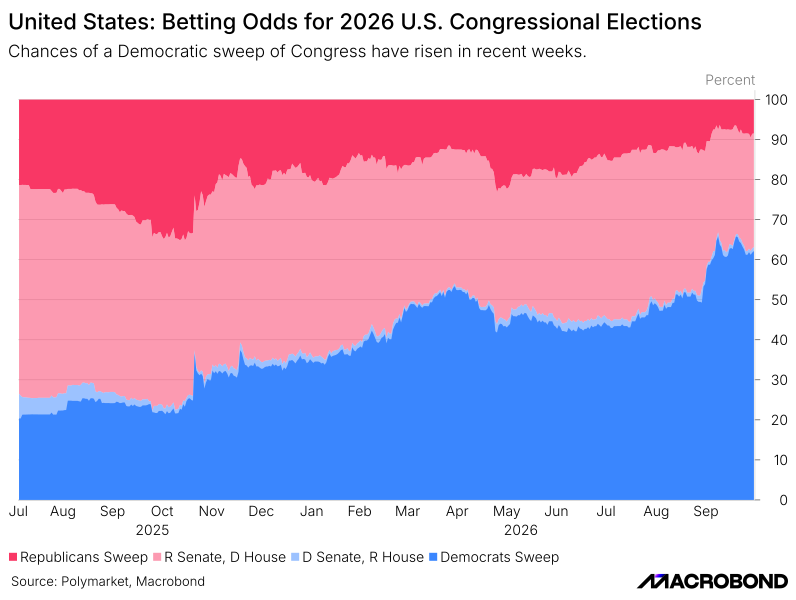
Markets Already Price It: Prediction markets have moved with the mood. According to Polymarket data, a Democratic sweep is now about 61% likely, up from roughly 20-25% a year ago, with the House the likelier gain and the Senate the real contest. However, polling and betting markets have been wrong before, and strong market and economic growth could still provide support to the party in power. Nevertheless, with sentiment this weak, markets are betting that prices will play the ultimate deciding factor this election season.
Insights
The chance of a Democratic sweep has risen steadily from around 20-25% in July-October 2025 to roughly 61% today, with a sharp step higher in September. The probability of a Republican sweep has shrunk to roughly 9%.
Most of the remaining probability sits in a split outcome with Republicans holding the Senate and Democrats taking the House, at around 29%. The reverse split, with Democrats taking the Senate and Republicans keeping the House, is priced as a very thin sliver. Markets are, in effect, treating the House as the likelier Democratic gain and the Senate as the real contest, where Polymarket puts a Democratic majority at roughly two in three.
Insights
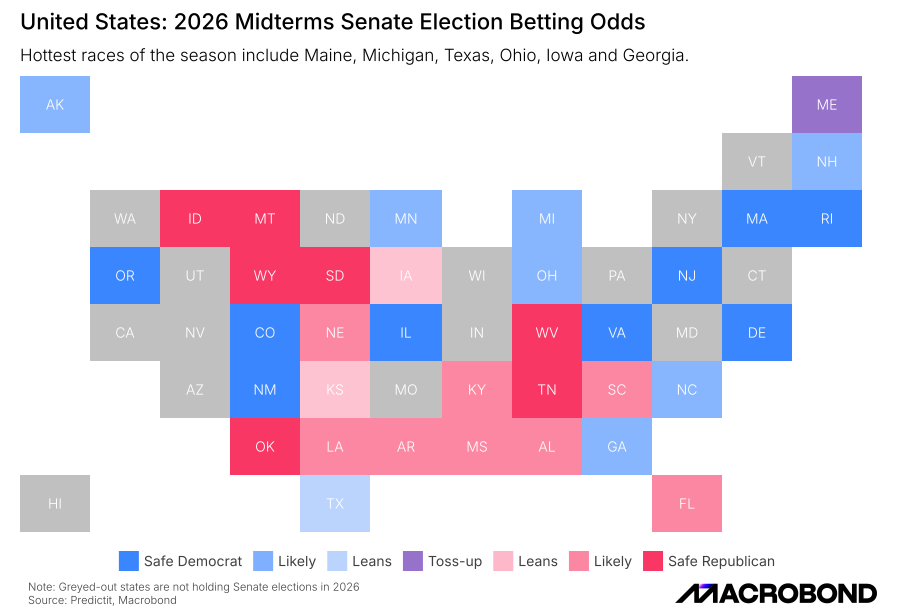
The Senate is where the uncertainty is concentrated. Maine, Michigan, Ohio, Texas, Georgia and Iowa are among the other races drawing the most attention, with Iowa and Kansas leaning Republican and several Democratic-leaning states in the competitive group.
Much of the map is already priced as safe or likely for one side, so the final balance of power is likely to come down to a handful of states. States shaded grey are not holding Senate elections this year.
Insights
Congressional approval remains very low, with about 23% approving and roughly two-thirds disapproving on this polling average, while some individual polls put it lower still, at 17% in a late-September survey. This is not a new development: approval has not been above 36% at any point in the past decade and spent much of 2015-16 near 12-13%.
The upshot is that low approval of Congress is a structural feature rather than a clean midterm signal. Its usefulness this cycle is likely to comeless from the level and more from whether the gap between approval and disapproval moves in the final weeks.
Insights
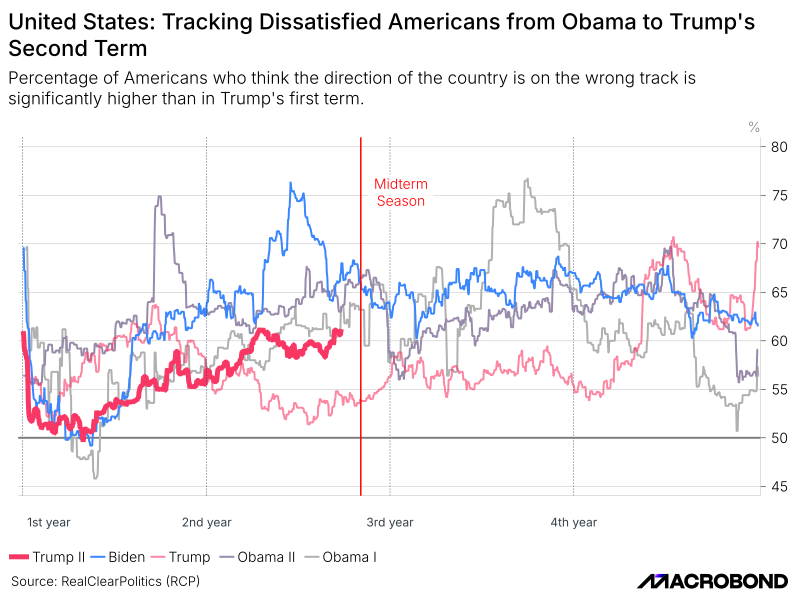
The share of Americans who think the country is on the wrong track has climbed steadily through Trump's second term, from about 50% in the opening months to roughly 61% now. That is materially higher than at the equivalent point of his first term, when the reading was in the low-to-mid 50s.
The comparison with other presidents is less stark. Biden and Obama both saw wrong-track readings in the mid-60s or higher around their own midterm seasons, so the current level is elevated against Trump's first term rather than against the broader history. The direction of travel is the more telling signal, since the gap has widened as the midterm season approaches.
Insights
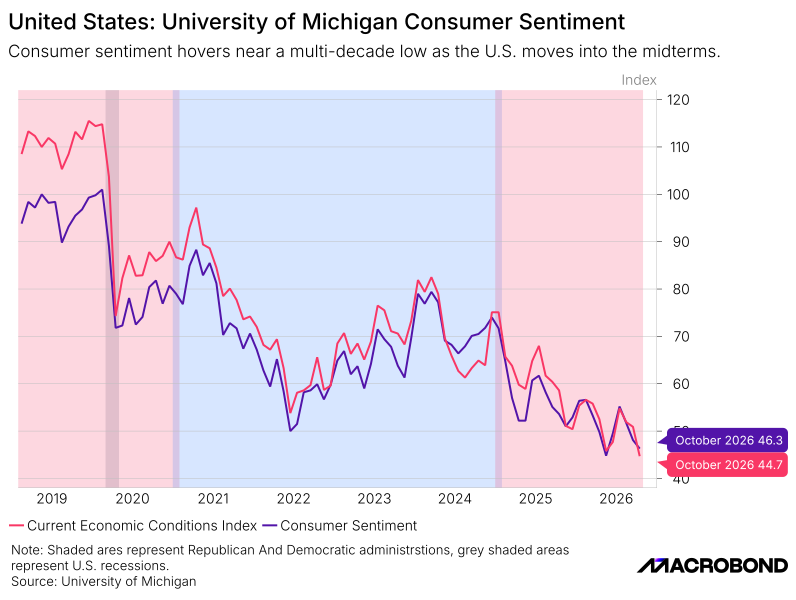
Consumer sentiment has fallen to a multi-decade low heading into the midterms. The preliminary October reading for the headline index is 46.3 and the current economic conditions index is 44.7, both below the troughs of the 2008-09 recession and the 2022 inflation shock on this chart, which starts in 1980. The headline index is only slightly above the record low of 44.8 set in May.
Households are therefore feeling worse about their finances than at almost any other point in the past four decades, even though unemployment is only about 4%. That gap between sentiment and hard data is central to the midterm story, since voters tend to respond to how conditions feel as much as to what the statistics show.
Insights
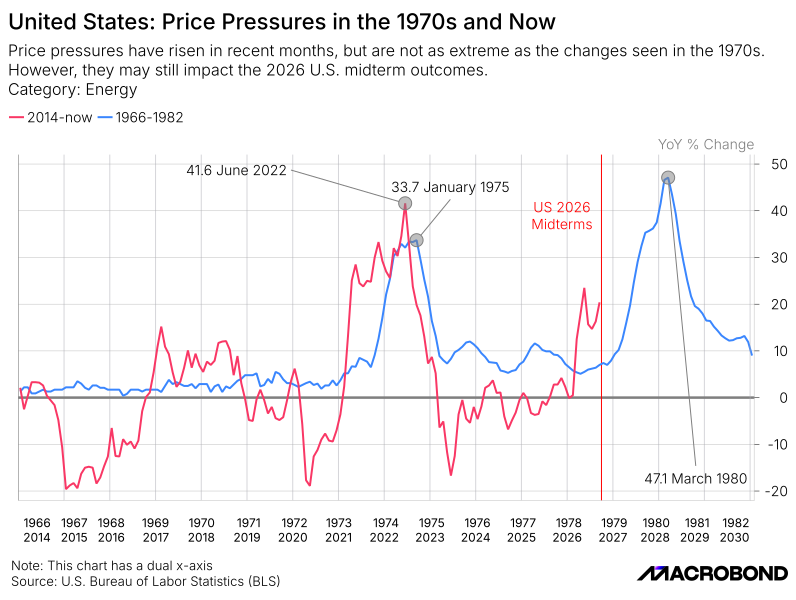
Energy price inflation has picked up in recent months, with the annual rate on the chart recently around 16% after touching roughly 23%. That remains well short of the 41.6% peak in June 2022 and the 47.1% reached in March 1980. The September CPI is due on October 14, and with pump prices uproughly a third on a year earlier, the annual rate may move higher again.
Aligning today with the late 1970s places the 2026 midterms at roughly the same point as 1978, which was followed by a second, much larger energy shock. The comparison is a reminder that price pressures can re-accelerate after a midterm, and even at today's more contained level they remain a likely factor in close races.
Insights
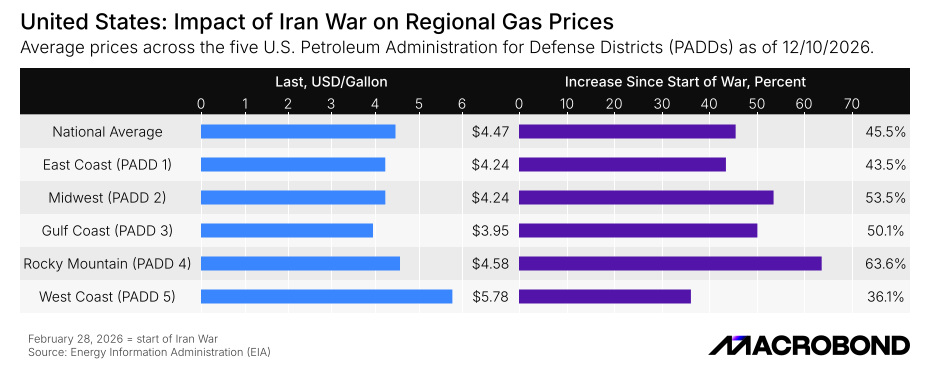
Gasoline is the most visible price in the economy, and it has risen sharply since the Iran war began on February 28. The national average is $4.47 a gallon, up 45.5%. The increases were largest in the Rocky Mountain and Midwest regions, and the West Coast has the highest level at $5.78, although its percentage rise was the smallest. The Midwest matters politically, since it includes Michigan, Wisconsin, Minnesota and Ohio. Arizona and Nevada sit in the high-priced West Coast district, and Pennsylvania, Georgia and North Carolina in the East Coast district, where prices rose 43.5%. Because drivers see these prices every day, a spike like this can weigh on sentiment even when stocks, wages and output are doing well. That may help explain why a solid economic backdrop isn’t translating into stronger approval ahead of the November 3rd midterms.
Insights
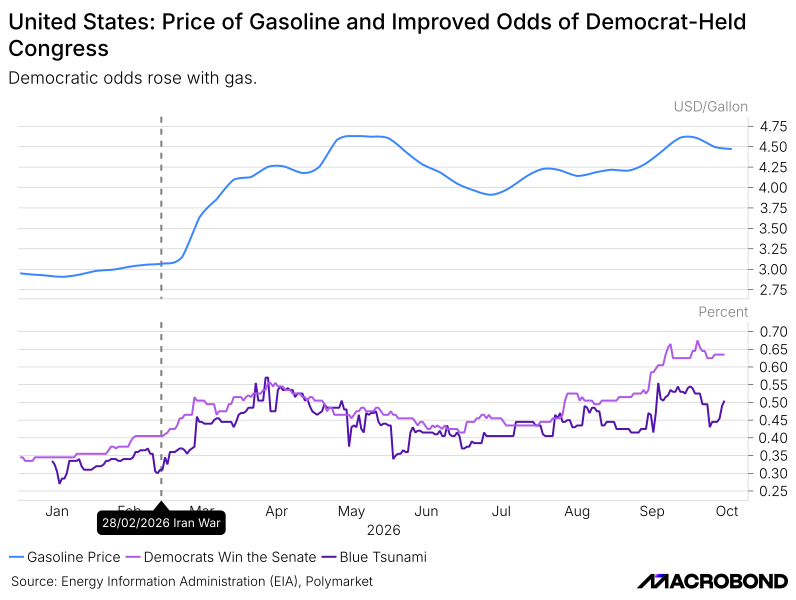
Since the Iran war began on 28th February, the average price of gasoline has risen from $2.94 to $4.47 a gallon. Over the same period, prediction-market odds of a Democratic Senate have climbed from about 40% to 64%. The Blue Tsunami contract (House 235+ and Senate 51+) has risen from 31% to 45%. Markets are treating the pump price as a proxy for the cost-of-living squeeze.
However, the relationship is not tight, and it has loosened lately. Senate odds jumped from about 50% to 64% since the end of August, while gas moved far less. Tsunami odds slipped from the mid-50s to 45% in late September with gas still high. Primaries and race-specific news are clearly also at work. With the September headline CPI reading coming in at 3.7%, it is clear that price pressures remain sticky.
Insights
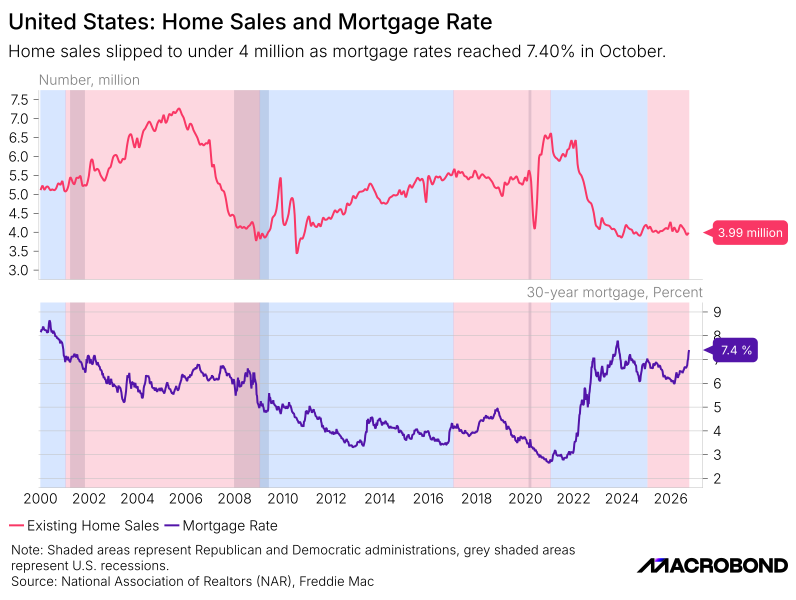
Mortgage rates are at 7.4% as of October, reversing months of gradual decline in 2025. Existing home sales have fallen to 3.99 million, well below the 2021 peak.
A key driver of the frozen market is the lock-in effect: homeowners with low fixed-rate mortgages have little incentive to sell. Doing so would mean giving up their existing rate and taking on a new mortgage above 7%. As a result, many choose to stay in place rather than list their homes, which keeps inventory low and sales suppressed.
This dynamic has persisted for nearly four years, since the 2022 rate shock first disrupted the market. Rates had drifted down toward 6%, suggesting a possible recovery, before reversing sharply back to 7.4% and undercutting that prospect.
The burden falls unevenly. First-time buyers, who are disproportionately younger, bear the brunt of reduced affordability. Existing homeowners are largely insulated from the rate increase, and the lock-in effect means they are also a structural reason why housing supply remains constrained.
Insights
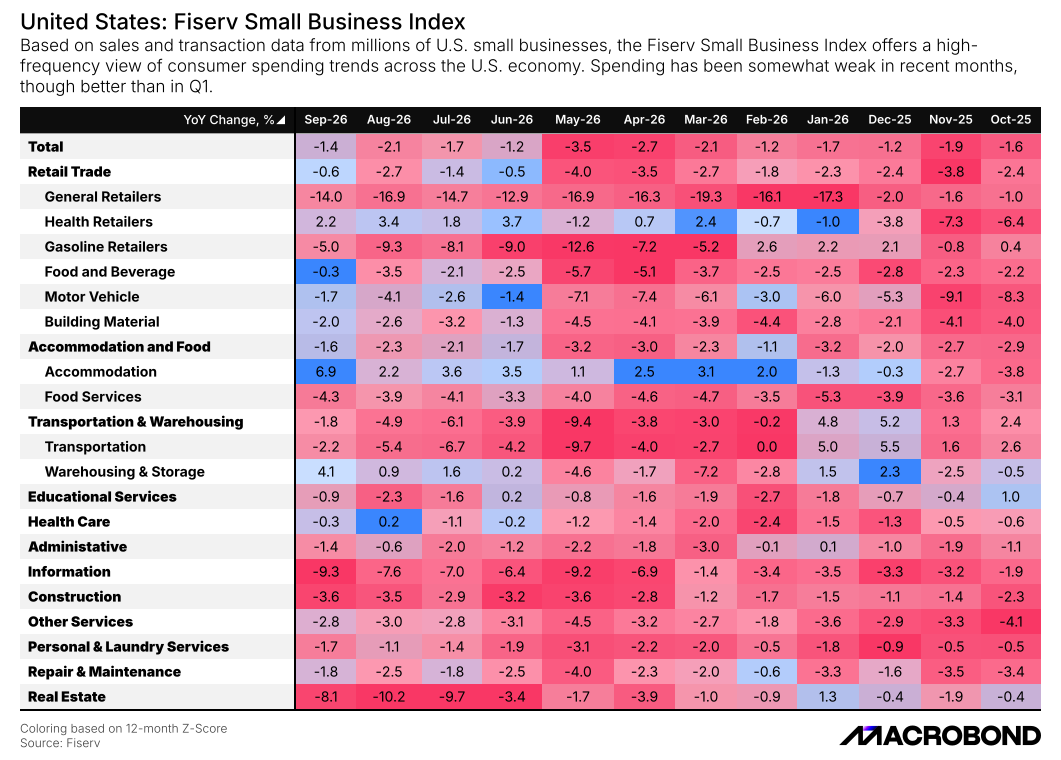
The Fiserv index is built from sales at millions of small businesses, so it measures consumer spending where voters live and work. It has been below the previous year in every month since last October, and it was weakest in the month gas prices peaked. That timing suggests households cut back elsewhere when the pump takes more of their budget.
Small businesses matter for the midterms in a way aggregate spending does not. They exist in every congressional district, they are where a local slowdown shows first, and the people who run them and work in them are the local voters who decide close races. Falling small-business sales are also how the squeeze becomes visible to people who never look at inflation data.
The sectors that fell most are general retailers, information and real estate, which fits households cutting discretionary spending and delaying big purchases. A few sectors are growing, such as accommodation, so the weakness is not universal. It is the clearest sign in this note that the pressure reaches ordinary local economies, which is what makes it a midterm issue and not only a data point.
Insights
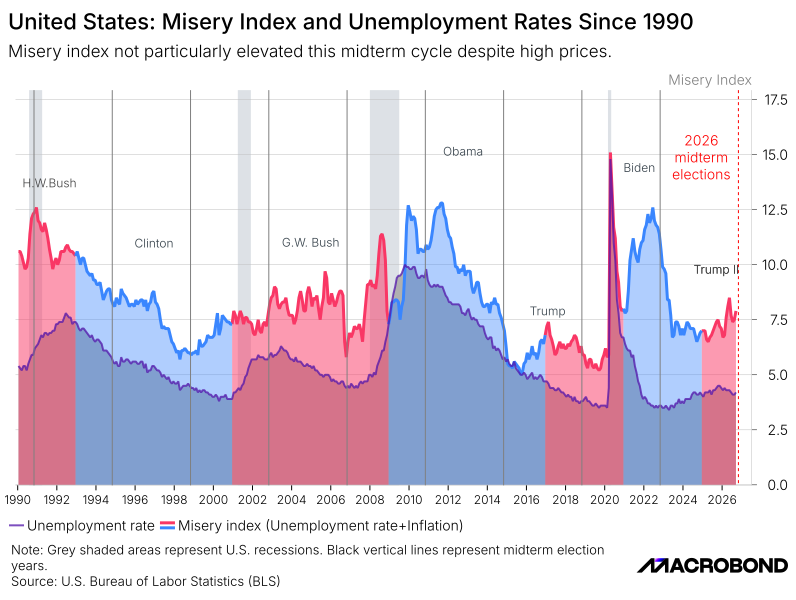
The misery index, which adds the unemployment rate to inflation, is not particularly elevated this cycle. At around 7.5 it sits well below the readings of roughly 12 seen in 1990, 2010-11 and 2022, and far below the pandemic spike to 15.
Unemployment is 4.2%, so the index is being driven more by inflation than by job losses, although September payrolls rose by only 29,000 and hiring is clearly cooling. This helps explain why the economic backdrop appears less damaging than the sentiment data would imply, and suggests that persistent price levels, rather than job losses, are the main economic grievance.
Insights
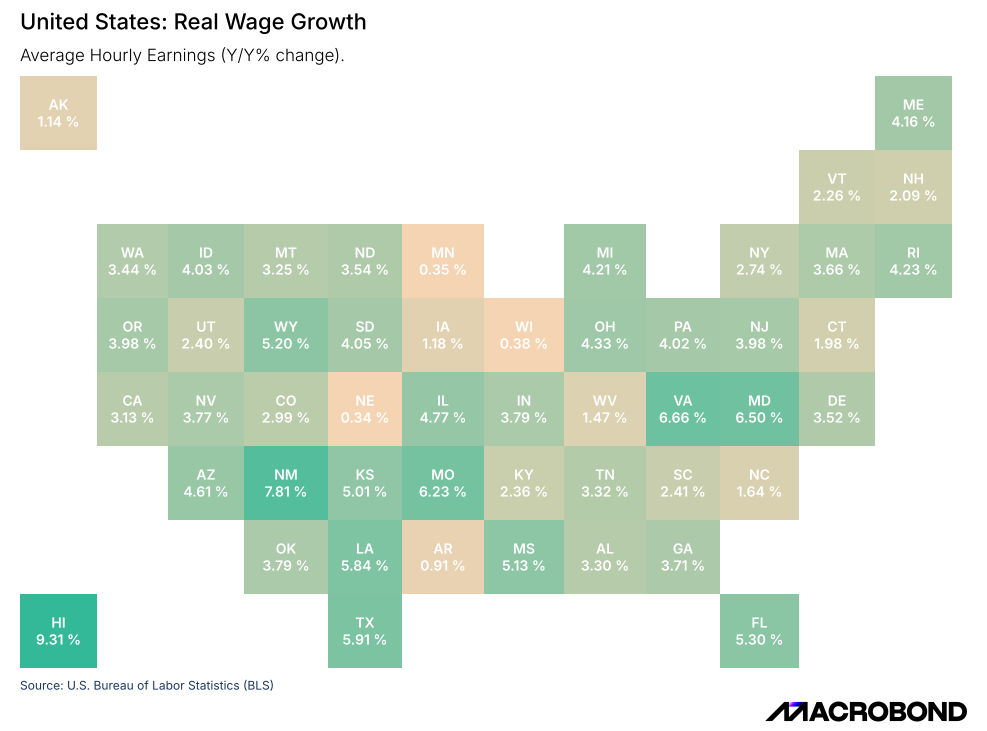
States are heading into the midterm season against the backdrop of strong labor markets. Real average hourly earnings are rising in every state, with gains above 4% across much of the Midwest, Mountain West and Gulf Coast. Hawaii, New Mexico, and Virginia lead. But the gains are uneven, and the weakest readings, in Nebraska, Minnesota and Wisconsin (all around 0.4%), are in the politically important Upper Midwest. Among battleground states, Michigan, Pennsylvania, and Arizona look solid, while Wisconsin and North Carolina lag. Rising real wages are one of the more direct ways households feel the economy, but they don’t always show up in sentiment, so the picture heading into the November 3rd midterms is favorable for incumbents but far from uniform.
Insights
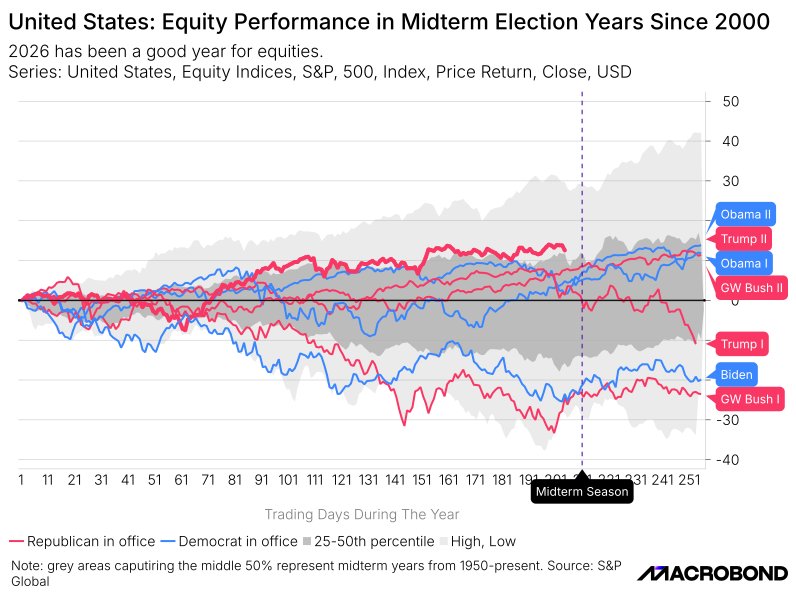
2026 has been a good year for equities. The S&P 500 is up roughly 12-14% so far this year, ahead of most previous midterm years and well above the weak years of 2022 and 2018, when the index finished the window with dramatic drawdowns.
The shaded band shows that midterm years since 1950 have typically been unremarkable for stocks, with the middle half of outcomes clustered in a fairly narrow range. Strong equity performance can support incumbents through the wealth effect, but it is unevenly felt, which may help explain why it is not translating into better sentiment.
Insights
Both of the last two midterm years were difficult for U.S. equities. The S&P 500 fell 6.2% in 2018 and 19.4% in 2022, while implied volatility was elevated: the VIX averaged 16.7 in 2018 and 25.6 in 2022. The deeper the drawdown, the higher the volatility. The pattern fits the familiar view that midterm years bring political uncertainty and choppier markets.
2026, by contrast, has actually exhibited strong equity performance. With the S&P 500 gaining in the low teens so far this year, the market is ahead of most previous midterm years and nowhere near the drawdowns that defined the last two cycles. Atypically strong market performance should provide support to the party in power, as rising portfolios lift the mood of households that own stocks. However, equity gains have clearly failed to translate into broad-based voter optimism.

Insights
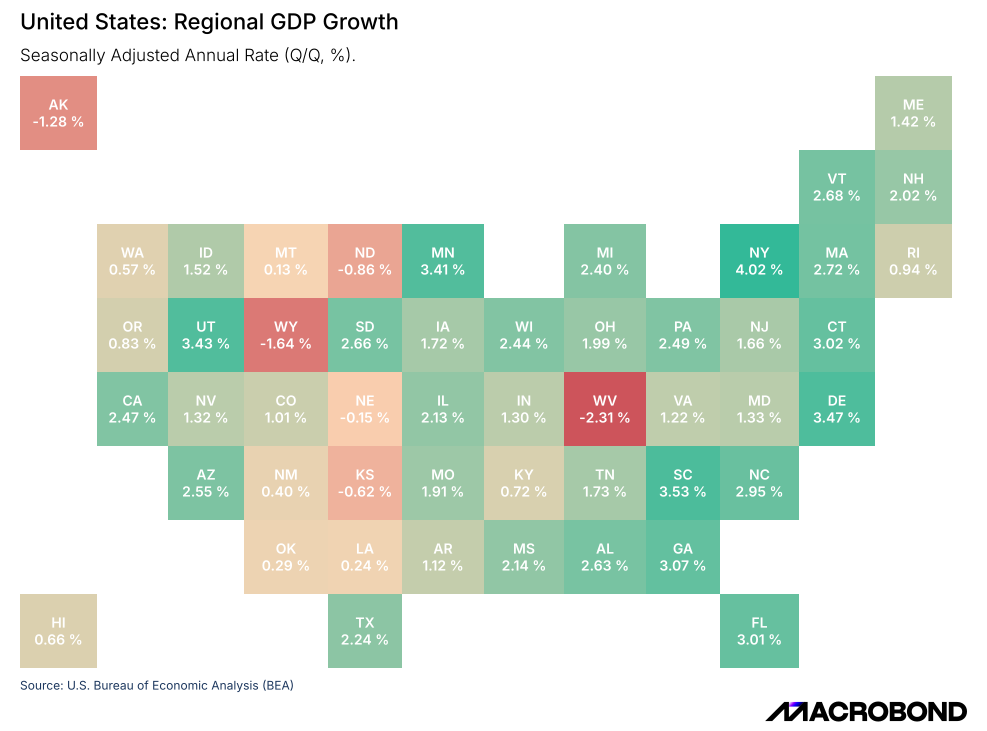
Economic growth is similarly broad, but uneven. Most states expanded last quarter, while six states contracted, concentrated in energy- and commodity-dependent parts of the country. The battlegrounds look healthy. Georgia, North Carolina, Arizona, Pennsylvania, Wisconsin, and Michigan are all expanding at a solid pace, with Nevada the soft spot. That is a favorable backdrop for incumbents ahead of the November 3rd midterms. But output growth doesn’t always reach households. Minnesota and Wisconsin, for example, grew solidly even though their real wage gains were among the weakest in the country, which may help explain why strong headline growth isn’t lifting sentiment.
The story of this election season is an economy that looks fine on paper but feels strained at the pump and at the closing table. Markets have read that mood as a tailwind for Democrats, pricing a sweep at roughly 61% and treating the Senate as the real contest. The next three weeks will test whether that holds. If prices drift lower, the squeeze loosens - giving sentiment room to recover and odds a chance to shift towards a split Congress. If pump prices spike again, mortgage rates push higher, or previously strong market and economic growth gives way, the mood sours further and a larger Democratic result becomes inevitable. Absent a shock, the disconnect between the data and the mood will most likely last through election day, leaving a handful of Senate races to deliver any surprise.


