Macrobond 1.25
Revision history in app
If you have a Data+ license, you can now access revision history. We collect revision history for more than 30 million time series in the Macrobond database.
If you do not have a Data+ license, please reach out to your Macrobond contact to learn more.
Revision history allows you to retrieve older vintages of a series as well as series of the initial release, first revision, second revision, etc. The latter is called the “nth revision”.
Here are two examples of how this can be used:
In the chart below, we compared the initial and last release for the US Private Nonfarm payrolls. In the 2nd pane, we calculated the difference between the two, which indicates us how frequent are upward or downward revision of the series.

This second chart uses specific vintages of a series. We took the DG ECFIN inflation forecasts for the Euro Area, and chose to display the past 8 vintages of the series for the year 2021 to see how – and at which pace – the CPI forecast has been revised upward throughout the year.

You can see if a series has revision history in the Data browser by the symbol ≡. There is a tooltip that will give you the range of revisions available.
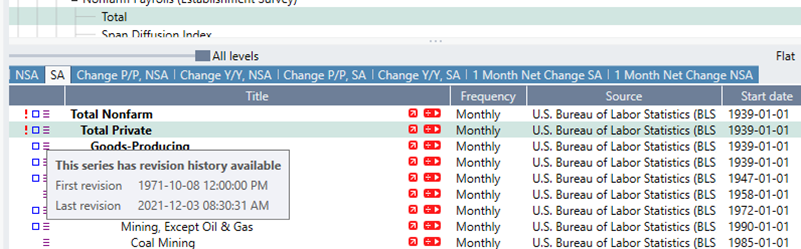
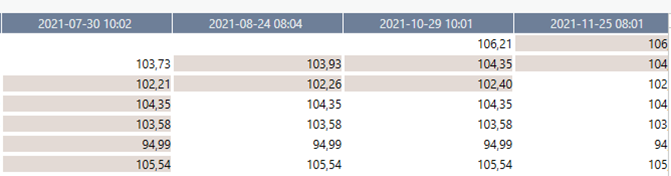
You can see an overview of all the revisions using the “View revisions…” command on the context menu of a series in the Data browser.
Vintages
There are a couple of different ways you can request vintages, historical version of time series.
Document setting
You can specify a timestamp in the Series list and the application will look for the vintages of all series in the document and attempt to use that data as it was known at the time specified. This will only be done for series where you have not explicitly specified a vintage already. See below for how you do that.
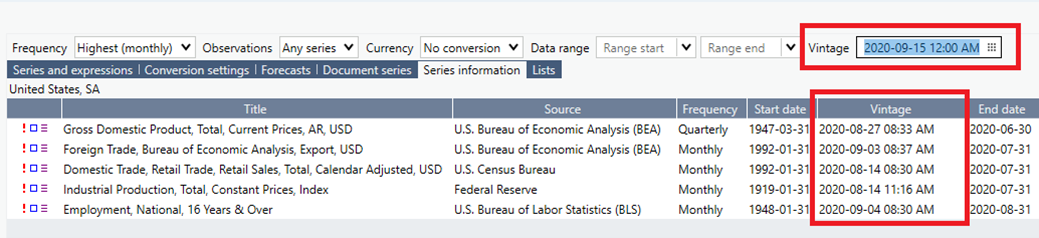
You will get a warning if there are series that either do not have revision history or if the history does not go as far back as requested. On the Series information tab, you can see details about what vintage that is actually used for each series in the document. Make sure that the Vintage column is included here (if it is not, right click on one of the existing columns and add the column Vintage in the dialog).
To illustrate this, we created a US GDP regression model. Using the timestamp in Series list allows us to view how the model looked like at the specific date. We chose 15 September 2020 as vintage to view if the model was accounting for the V-shape economic recovery back then. In the Series Information tab, you can check which vintage has been used for each series of the document.


Series expression
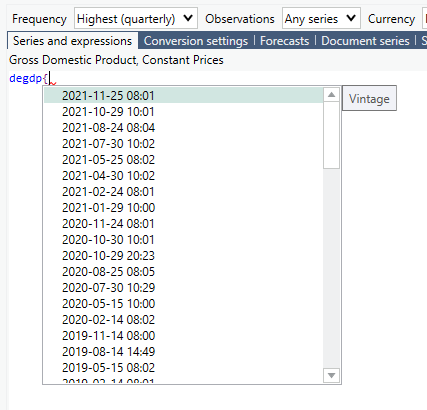
You can pick a specific vintage for a series by specifying a timestamp as part of the series expression. This is done by using the format “series{yyyy-mm-dd HH:mm +/-tz}” or “series{yyyy-mm-dd +/-tz}”. When no time is specified, it will refer to midnight. “tz” here is a numerical value identifying the time zone offset. The easiest way to do this is to use the formula editor, and type “{“ after a series name. If this series has revision history, you will be presented with a list of existing vintages to pick from.
You can specify a vintage also for lists, and this will then be applied to all series in the list. There will be a warning if the specified vintage is not available for one or more series in the list.
A vintage can also be specified for ratios and calculated series. The vintage will then be requested for all series used in that calculation. For example, “#PerCapita(usgdp){2020-01-01+1}”.
Another way to add vintages is to select them from the context menu of the Data browser:
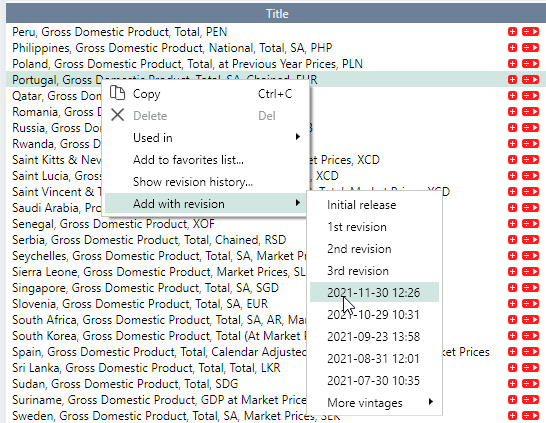
Nth revision
In the formula editor, you can enter “series{n}” where n is the nth revision or select it from the context menu of the Data browser. The number 0 will give you the initial release.
For example, the expression “usgdpcp{0}” will result in a series consisting of the initial releases, the unrevised values, of each observation for the US GDP series (in current prices). The series will go as far back as there are revision history for the series.
.png)
Please note that for observations where there are not as many revisions as requested, there will be a missing value in the series. This will often be the case for the last value. It is a good habit to turn off the automatic missing value method and select to not fill in missing values for revision series.
List improvements
Shared lists of series
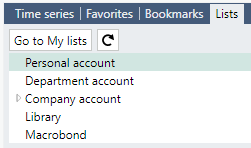
In the previous version, 1.24, we introduced the concept of “lists of series” that can greatly simplify cases where you want to apply the same calculations on many series. What is new in 1.25 is that you can now share lists between documents and users. Shared lists are created and found in the new My lists tab:

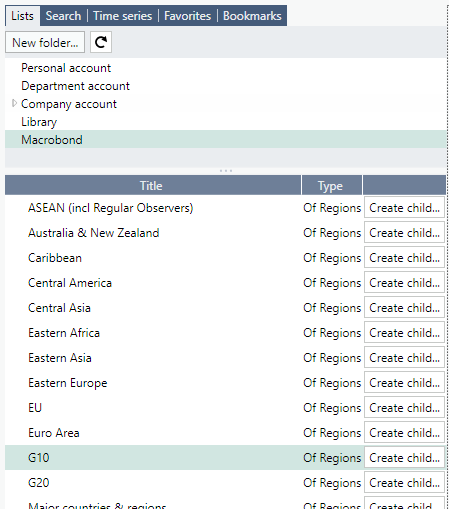
In a document, you can find the lists in the tab called Lists in the Data browser where you can add them to your document:
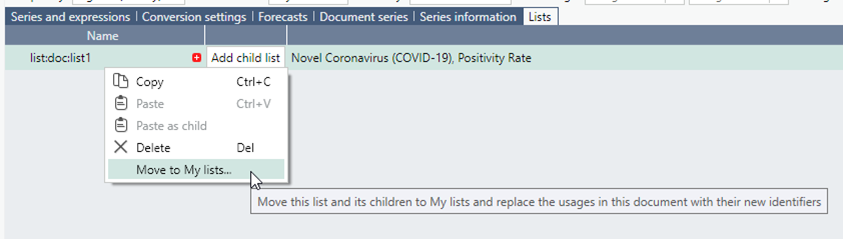
Lists in documents can be moved or copied to a shared location with a new command on the context menu:
Derived lists
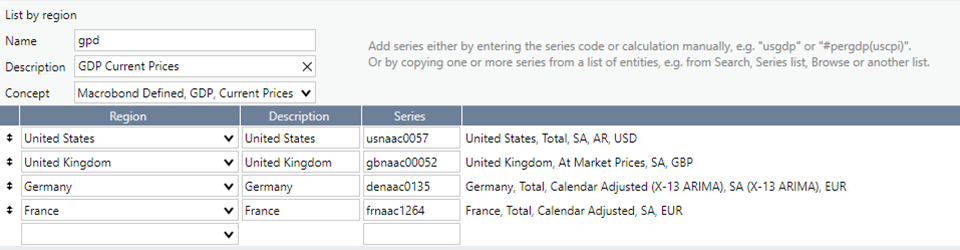
If you have a list with regions, you can use the Concepts in the Macrobond database to automatically find corresponding series. You can complement or override with other series.
In a document, you do this by creating a list by region, and the select a Concept:
You can create a child list of such a document and select another Concept. In this way you can easily create lists with corresponding series for a set of regions.
Another option is to use list of regions as a parent and then select a Concept. Lists of regions can be created in the My lists activity. There are also several lists provided by Macrobond. The lists of regions are the same lists you can use as filters when browsing and searching for series.
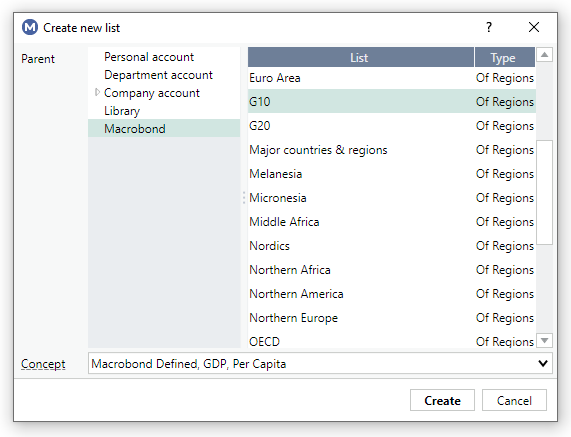
When you create a child list, you can select a list of regions as a parent in the dialog:
Transpose analysis
There is a new analysis called Transpose that works on category series. It will create series from the observations across a set of series. You can use this to switch columns and rows in a case like this:

Grading on y-axis
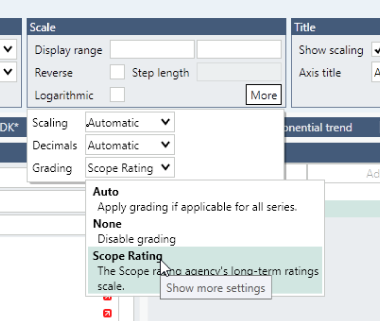
For certain time series, you can match the values of the y-axis to grading labels.

Currently there is one scheme of grading labels used for data from Scope Ratings, but additional schemes may be added in the future. Data from this source will automatically use this setting, but you can change this in the settings for the y-axis.
Create Presentation document from selection in Watchlist
There is a new shortcut that makes it easy to create a Presentation document by selecting one or more items in the Watchlist activity. This can be used to quickly create a presentation with the charts that have recently been updated or which will soon be updated.

Excel add-in
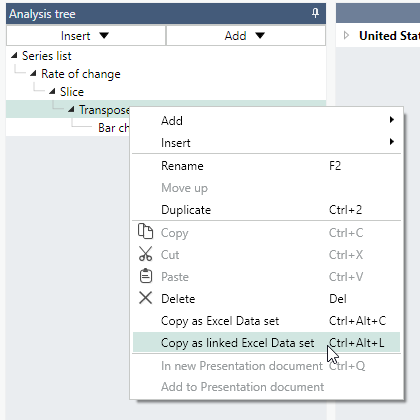
Links to MB document in Excel datasets
A Macrobond Data set in Excel can now link to a Macrobond document instead of embedding it. This can be useful if you want to use the same data set in several Excel sheets and make changes only in one place, but please note that this also makes it more fragile. If the document is changed or even removed, it will affect your Excel models.
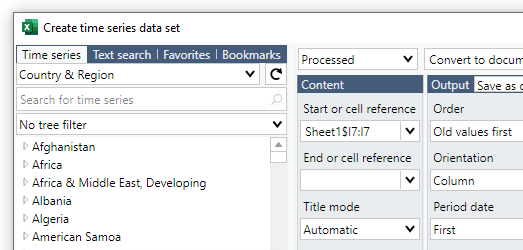
Cell reference for data range in Excel
It is now possible to enter a cell reference to a cell with a date, to be used for specifying the date range to import. This can be useful when you have several data sets that should use the same date range.
Smaller improvements
- Notifications from the Watchlist now integrates with the Windows notification system on Win 8 and later. This means that you can interact with them in the same way as most other notifications.
- When creating in-house time series, you can now pick from a more extensive set of regions.
- Improved copy/paste of series and lists.
- Shorter calculation time for some complex formula expressions.
Changed requirements
We no longer support 32-bit Windows.
This version requires 64-bit Windows, which almost all users of Macrobond are already running.