Macrobond 1.16
With version 1.16 of the application you will find that working with documentation & charts is much simpler and more efficient. From creating dynamic presentations to tweeting charts, making use of your work product easily, in a variety of contexts, has been a central focus of this update.
The following text will guide you through these & other changes: what they are, where you can find them, and the different ways you can make use of them.
Click on the link for How to upgrade in the Overview section below if you would like more information.
Overview of what’s new
Presentation documents, Analytics & charting, Exporting & sharing charts, Navigating the application, Document handling, How to upgrade
Presentation documents
As the name suggests, presentation documents are used to organize charts and tables so that you can easily and professionally showcase an overview of your work. The Presentation documents window opens outside the application to give you more flexibility for working with, sharing and presenting charts. Charts can be organized by pages and in folders.

An example of two pages in Presentation documents, containing six charts each.
Benefits of Presentation documents
- Get an overview of multiple charts at once. You can make changes to the charts in the application and see this reflected in the presentation document in real-time. The Presentation documents window can be viewed on a second monitor to enhance your ability to work with multiple charts efficiently.
- Add and organize an unlimited number of charts from different documents in one place. Save presentation documents for your personal use or for sharing with others. You can browse through the pages using the Page Down and Page Up keys on your keyboard.
- Print or export a presentation document with a number of charts (in this version PDF creation only works on Win10). This will then work as an alternative to PowerPoint.
A simple, dynamic alternative to PowerPoint
While Presentation documents does not have the same formatting options as PowerPoint, it does contain some simple editing options. It also allows you to present dynamic charts. For example, you can easily:
- Create presentations with a multitude of charts. Simple header and footer options are available for adding text, as well as formatting columns for chart display. Style sheet options include selecting text positioning, size, color, font, and background color.
- Easily share presentations in the application. By using your company account, for example, just like you do with other Macrobond documents.
- Avoid broken links between the application and your presentation documents. You will be warned before deleting documents that are linked. See which documents are being used for presentations, and in which presentations documents they are being used.
We plan to make it possible to view these documents on the web based Macrobond.NET in the future.
To get started with Presentation documents have a look at this easy-to-follow help guide.
If you have already installed the new version click on this link to see a sample presentation document: Macrobond chart library : What’s new/1.16/Presentation/Sweden summary.
If you have not updated yet click on the yellow ribbon that you’ll see when you open the Macrobond application.
Exporting & sharing charts
To help you share your insights quickly with a larger audience, you can now send charts directly to Twitter from the Macrobond application. You can select the size of the image (which affects the amount of characters used) as well as add an accompanying text.
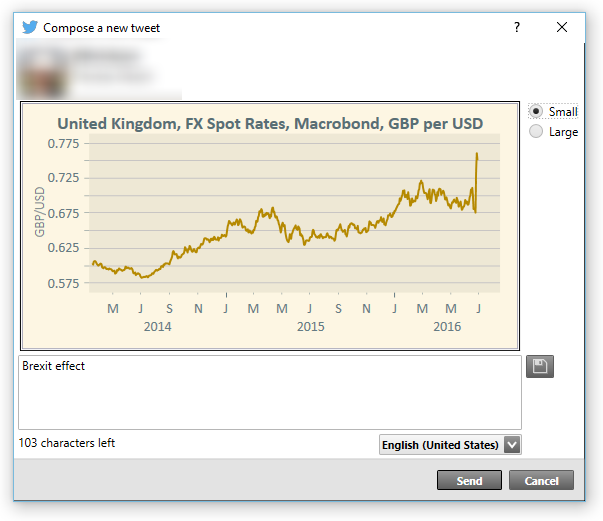
An example of how the Twitter dialog box will appear in the application.
When you have a chart open, go to File and select Send to Twitter. The first time you use this feature, you’ll be asked to log in to your twitter account via the Macrobond application, in order to approve access.
If you want to revoke the application’s access to your Twitter account. You can do so on the Twitter “Applications” page.
For a more detailed explanation see the help page.
SVG
Use SVG to smoothly export your charts and tables to the web, or programs such as Adobe Illustrator and InDesign. In addition to PNG (bitmap) and EMF (metafile) we now offer a format called SVG via the export, web publish and copy to clipboard functions. To adjust the way text and fonts are handled in SVG go to Edit | Settings | SVG, in the top menu bar.
See the help page for this feature here.
Share
On the same topic of reaching a broader audience more easily, if you run Windows 10 you can now send images of Macrobond charts to Windows apps. Sharing is as simple as opening the relevant chart, and selecting one of the multiple ways to share the image: via the File menu, the toolbar, context menu, or with the Ctrl+H shortcut. There is also a Share button in the Web publish activity in the Macrobond application.
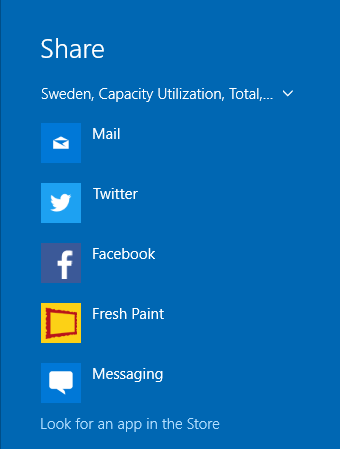
The Share feature will bring up the standard Windows 10 share options similar to this.
Document handling
Document revisions
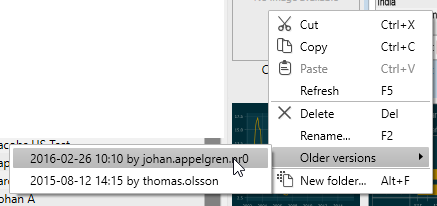
To give you greater control over your work product it is now possible to revert to older versions of a document. For documents stored in one of the account storages, you can access the last 10 versions. These versions will be available for up to one year. This feature is also available for Style sheets.
Right click on a document in the File, Open dialog and you will see an item called Older versions:
Recently deleted
To make sure you don’t accidentally lose valuable documents, all deleted documents or folders stored in a company account will be moved to a folder called Recently deleted. Documents will be stored here for a few months, allowing you to retrieve them.
This folder will always be last in your list of folders. The folder will be created automatically the first time you delete something, but you may need to press refresh to view it immediately.
Documents will automatically be deleted from the “Recently deleted” folder after a few months.

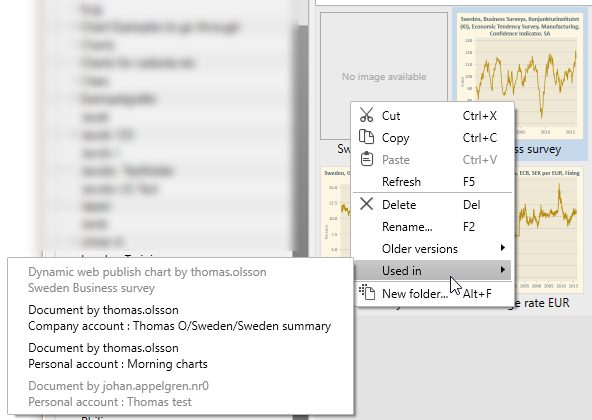
Referenced documents
You can see if a document is used in Presentation documents or published on the web using the Web publish feature by selecting Used in from the context menu of a document. You can open presentation documents from this menu if you have access to them.
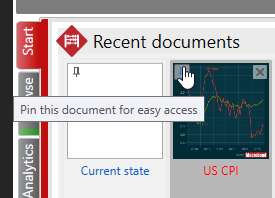
Pin documents
For documents you need to access quickly or frequently, you can now pin to the top of the start activity. Pinned documents will always the first of the recently opened documents shown. Hovering your mouse over the document will activate the pin symbol. Simply click on it to pin the document.
Analytics & charting
Confidence bands in VAR
We have added an option for generating series for the confidence band in the VAR analysis. You can select whether you want to include the parameter uncertainty or not. This could potentially be a heavy calculation.
Trend output from X13
There is a new option called Calculate trend in the Seasonal Adjustment Census X-13 analysis. This will produce an extra time series containing the trend output from the seasonal adjustment model.
Data range in the series list
You can specify an optional data range in the series list if you want to limit the time series used in the document. The range is applied to the series before any other operations, such as frequency conversion.

Hold shift key to lock annotations
Holding the shift key down when drawing line or arrow annotations will ensure that your lines are perfectly horizontal or vertical.
Holding the shift key down when changing the size of text boxes will constrain the text box to square proportions.
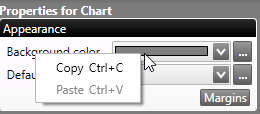
Copy/paste colors
You can now copy a selected color using the copy and paste commands, and apply this to the color settings for other segments of the chart.
Navigating the application
Always show start page
The start activity will now be shown by default when you open the application. If you would like start with the most recently used activity, uncheck the option Always show this activity when starting, in the lower right corner of the start activity.

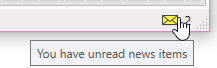
Unread news notification
There is a new indicator in the status bar that tells you if there are any unread news items. This is where you can find out about new data added to the application database, new features and fixes to the application, and posts such as the Development team’s blog. Click the links in the notifications to read the news on our website.
How To Upgrade
The new version can be installed directly via the Macrobond application by clicking the yellow ribbon, which appears on the screen, or by selecting Check for update on the Help menu. If you need assistance, a description of how to upgrade may be found here.
In Macrobond 1.16 we have dropped support for Windows XP, Windows Vista, Windows Server 2003 and Windows Server 2008. The minimum requirements are now Windows 7 or Windows Server 2008 R2.
If you are running a version of Windows not supported by this version of Macrobond, you can continue to run the older version until support ends for that version. Those dates can be found here: https://help.macrobond.com/additional-materials/product-versions/
Please note that this upgrade requires admin rights, so you may need to ask your IT department for assistance.
If you are unable to make use of automatic updates or use the setup program on https://redir.macrobond.com/go/installation, then please note that upgrades to 1.16 cannot be done by simply installing a patch (MSP file). You need to install the base installation (MSI file) and the corresponding patch (MSP file).