
You control how your research is managed, shared, and measured. Publish in the format that works best for you, whether PDF, PowerPoint, Word, or social media. Your work stays relevant and continues to deliver value, no matter how times, tools, or teams evolve.

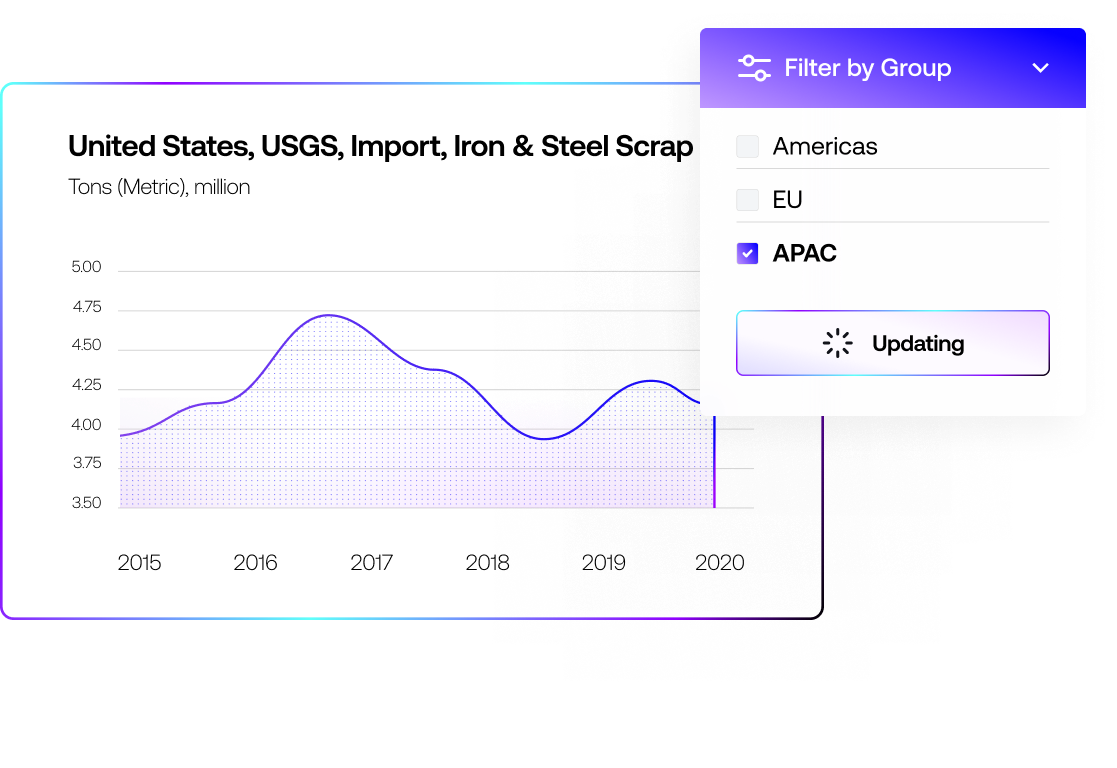


Integrate seamlessly with your content management system, so your latest analysis can be published without extra steps or manual formatting.
Post charts directly from Macrobond to LinkedIn in the preferred format, making it effortless to share insights with your professional network.
Export reports in PDF with dynamic, professional visuals that are ready to share across teams or with clients.
.svg_432.png)
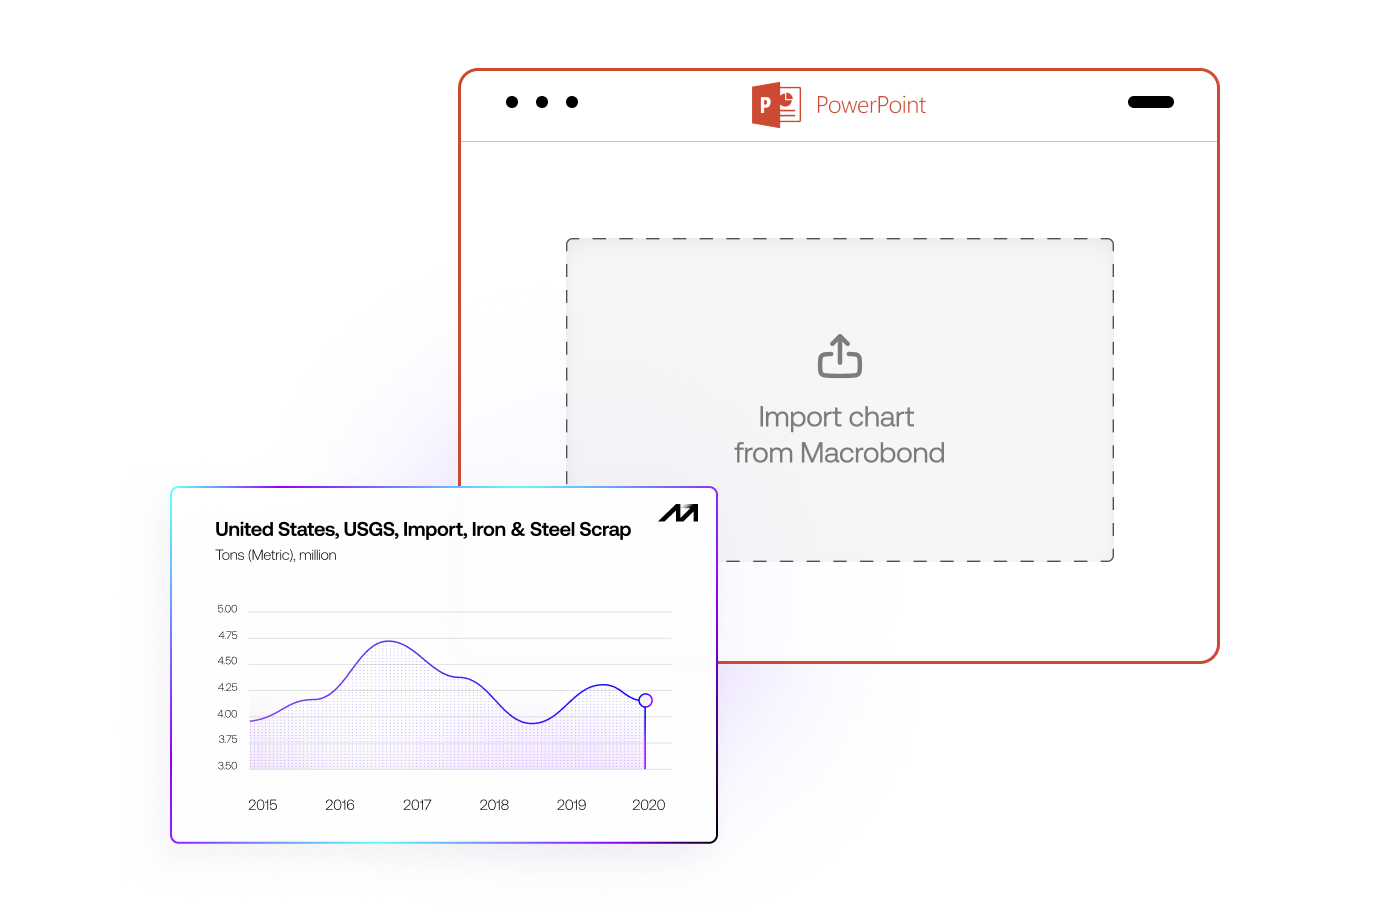
Keep presentations always up to date. Charts stay linked to live data, so refreshing an entire deck takes seconds, not hours.

Use crisp, scalable SVG charts on your website for interactive and engaging experiences that update easily.
Publish polished visuals directly to X in the right format, helping your research reach a wider audience instantly.
